NZD/USD Price Forecast: Struggles at 100-day SMA ahead of US CPI
- NZD/USD climbs on softer inflation data, but buyers struggle to clear key 100-day SMA hurdle at 0.5959.
- Momentum remains bullish yet flattish on RSI, signaling potential consolidation ahead of Thursday’s US CPI release.
- Break above 0.5996 opens path to July highs, while downside risks emerge below 0.5900 toward 0.5886 and 0.5836.

The New Zealand Dollar advanced on Wednesday, posted gains of over 0.24% as traders digested the latest factory gate inflation report. An evolution of the disinflation process, drove the NZD/USD pair higher, past the 0.9540 mark during the day.
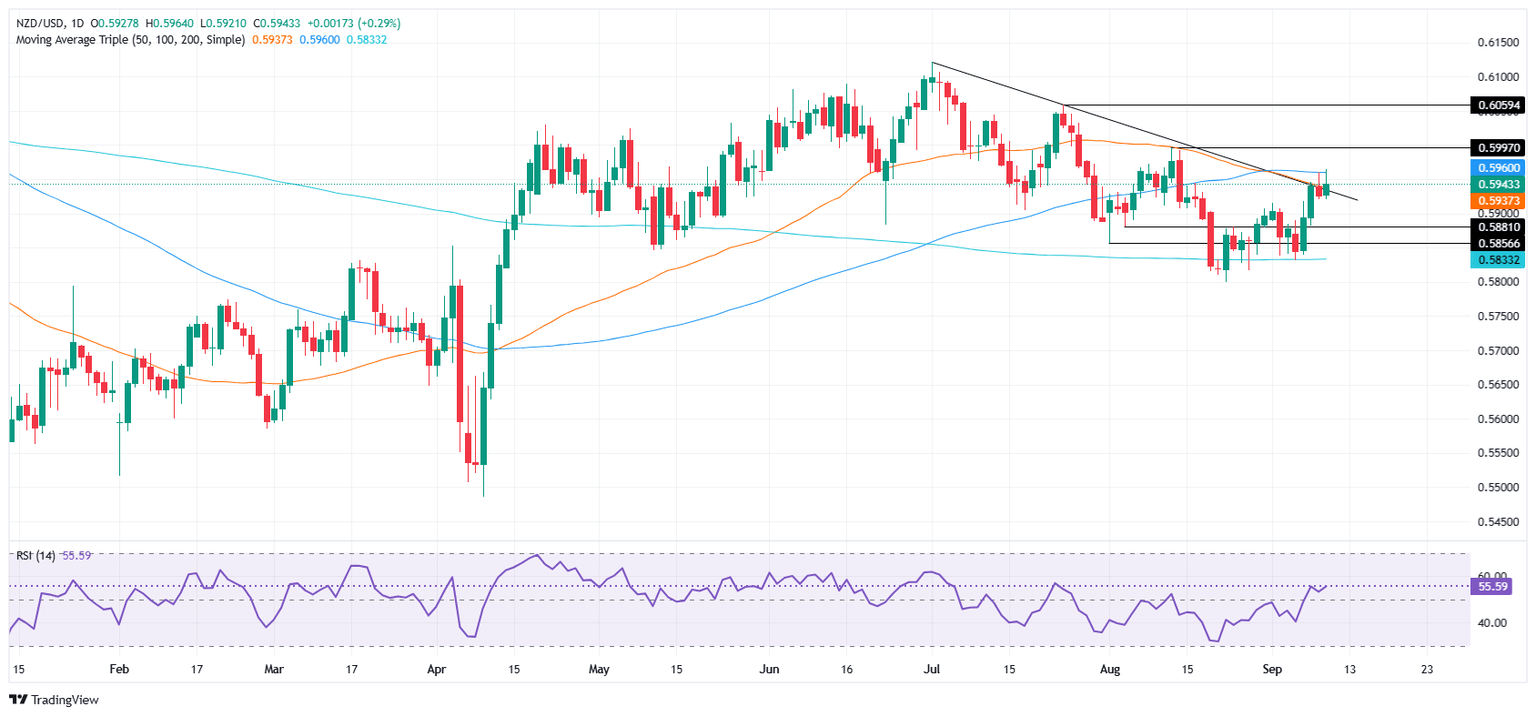
NZD/USD Price Forecast: Technical outlook
Price action shows buyers reluctancy to drive NZD/USD past the 100-day Simple Moving Average (SMA) at 0.5959. Although momentum as depicted in the Relative Strength Index (RSI) is bullish, it has turned slightly flattish. Hence, further sideways trading lies ahead, unless the release of US CPI data on Thursday rocks the boat.
If NZD/USD climbs past the 100-day SMA, the next resistance will be the August 13 peak at 0.5996, followed by the July 24 cycle high at 0.5059. On the other hand, if the pair slides below 0.5900, the first support would be the 20-day SMA at 0.5886, ahead of the 200-day SMA at 0.5836.
NZD/USD Price Chart — Daily
New Zealand Dollar Price This week
The table below shows the percentage change of New Zealand Dollar (NZD) against listed major currencies this week. New Zealand Dollar was the strongest against the Canadian Dollar.
| USD | EUR | GBP | JPY | CAD | AUD | NZD | CHF | |
|---|---|---|---|---|---|---|---|---|
| USD | 0.08% | -0.22% | -0.60% | 0.21% | -0.96% | -0.82% | 0.03% | |
| EUR | -0.08% | -0.32% | -0.60% | 0.12% | -1.04% | -0.85% | -0.05% | |
| GBP | 0.22% | 0.32% | -0.38% | 0.43% | -0.72% | -0.54% | 0.26% | |
| JPY | 0.60% | 0.60% | 0.38% | 0.75% | -0.38% | -0.36% | 0.65% | |
| CAD | -0.21% | -0.12% | -0.43% | -0.75% | -1.06% | -0.98% | -0.18% | |
| AUD | 0.96% | 1.04% | 0.72% | 0.38% | 1.06% | 0.18% | 0.99% | |
| NZD | 0.82% | 0.85% | 0.54% | 0.36% | 0.98% | -0.18% | 0.81% | |
| CHF | -0.03% | 0.05% | -0.26% | -0.65% | 0.18% | -0.99% | -0.81% |
The heat map shows percentage changes of major currencies against each other. The base currency is picked from the left column, while the quote currency is picked from the top row. For example, if you pick the New Zealand Dollar from the left column and move along the horizontal line to the US Dollar, the percentage change displayed in the box will represent NZD (base)/USD (quote).
Author

Christian Borjon Valencia
FXStreet
Markets analyst, news editor, and trading instructor with over 14 years of experience across FX, commodities, US equity indices, and global macro markets.


