NZD/USD Price Forecast: Remains subdued near 0.5600 support amid prevailing bearish bias
- NZD/USD could test key support at the lower boundary of the descending channel near 0.5560.
- The 14-day Relative Strength Index remains below 50, reinforcing the bearish outlook.
- The pair may target initial resistance at the nine-day Exponential Moving Average of 0.5654.

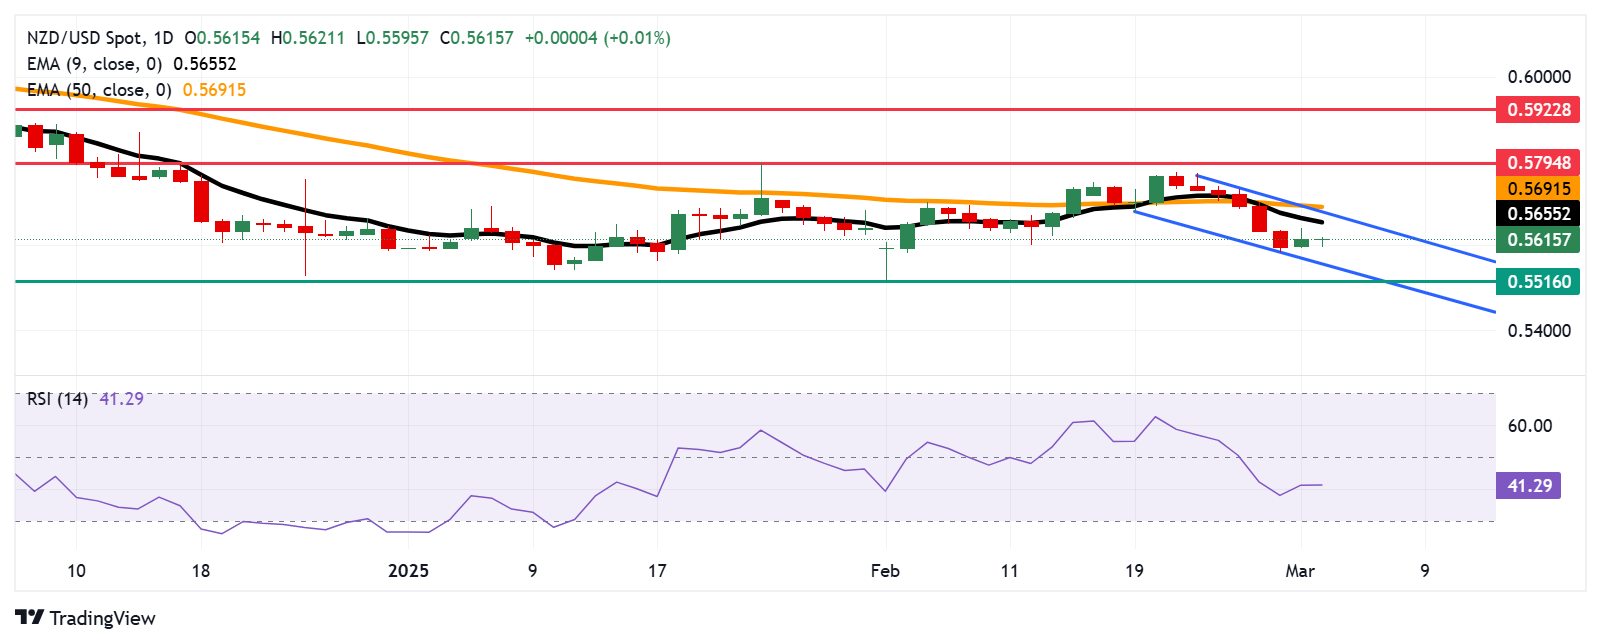
The NZD/USD pair loses ground following the previous session’s gains, trading around 0.5610 during European trading hours on Tuesday. Technical analysis of the daily chart indicates a bearish bias, with the pair trending lower within a descending channel.
The 14-day Relative Strength Index (RSI) remains below the 50 mark, reinforcing the negative outlook. Additionally, NZD/USD continues to trade beneath the nine-day Exponential Moving Average (EMA), signaling weak short-term momentum.
On the downside, a decisive break below the psychological support level of 0.5600 could push the pair toward the key support at 0.5560, the lower boundary of the descending channel. A further decline below this level may intensify selling pressure, potentially dragging NZD/USD to 0.5516—its lowest level since October 2022, recorded on February 3.
Conversely, a recovery could see the pair targeting initial resistance at the nine-day EMA of 0.5654, followed by the descending channel’s upper boundary at 0.5680 and the 50-day EMA at 0.5691. A breakout above the channel would weaken the bearish sentiment and open the door for further gains toward the three-month high of 0.5794, reached on January 24.
NZD/USD: Daily Chart
New Zealand Dollar PRICE Today
The table below shows the percentage change of New Zealand Dollar (NZD) against listed major currencies today. New Zealand Dollar was the weakest against the Swiss Franc.
| USD | EUR | GBP | JPY | CAD | AUD | NZD | CHF | |
|---|---|---|---|---|---|---|---|---|
| USD | -0.23% | -0.13% | -0.19% | -0.19% | 0.25% | 0.01% | -0.35% | |
| EUR | 0.23% | 0.11% | 0.06% | 0.05% | 0.48% | 0.25% | -0.13% | |
| GBP | 0.13% | -0.11% | -0.04% | -0.07% | 0.37% | 0.14% | -0.23% | |
| JPY | 0.19% | -0.06% | 0.04% | -0.00% | 0.44% | 0.20% | -0.16% | |
| CAD | 0.19% | -0.05% | 0.07% | 0.00% | 0.44% | 0.21% | -0.16% | |
| AUD | -0.25% | -0.48% | -0.37% | -0.44% | -0.44% | -0.22% | -0.59% | |
| NZD | -0.01% | -0.25% | -0.14% | -0.20% | -0.21% | 0.22% | -0.37% | |
| CHF | 0.35% | 0.13% | 0.23% | 0.16% | 0.16% | 0.59% | 0.37% |
The heat map shows percentage changes of major currencies against each other. The base currency is picked from the left column, while the quote currency is picked from the top row. For example, if you pick the New Zealand Dollar from the left column and move along the horizontal line to the US Dollar, the percentage change displayed in the box will represent NZD (base)/USD (quote).
Author

Akhtar Faruqui
FXStreet
Akhtar Faruqui is a Forex Analyst based in New Delhi, India. With a keen eye for market trends and a passion for dissecting complex financial dynamics, he is dedicated to delivering accurate and insightful Forex news and analysis.


