NZD/USD Price Forecast: Advances toward 0.6050 after breaking above nine-day EMA
- NZD/USD may find initial resistance at the eight-month high of 0.6081.
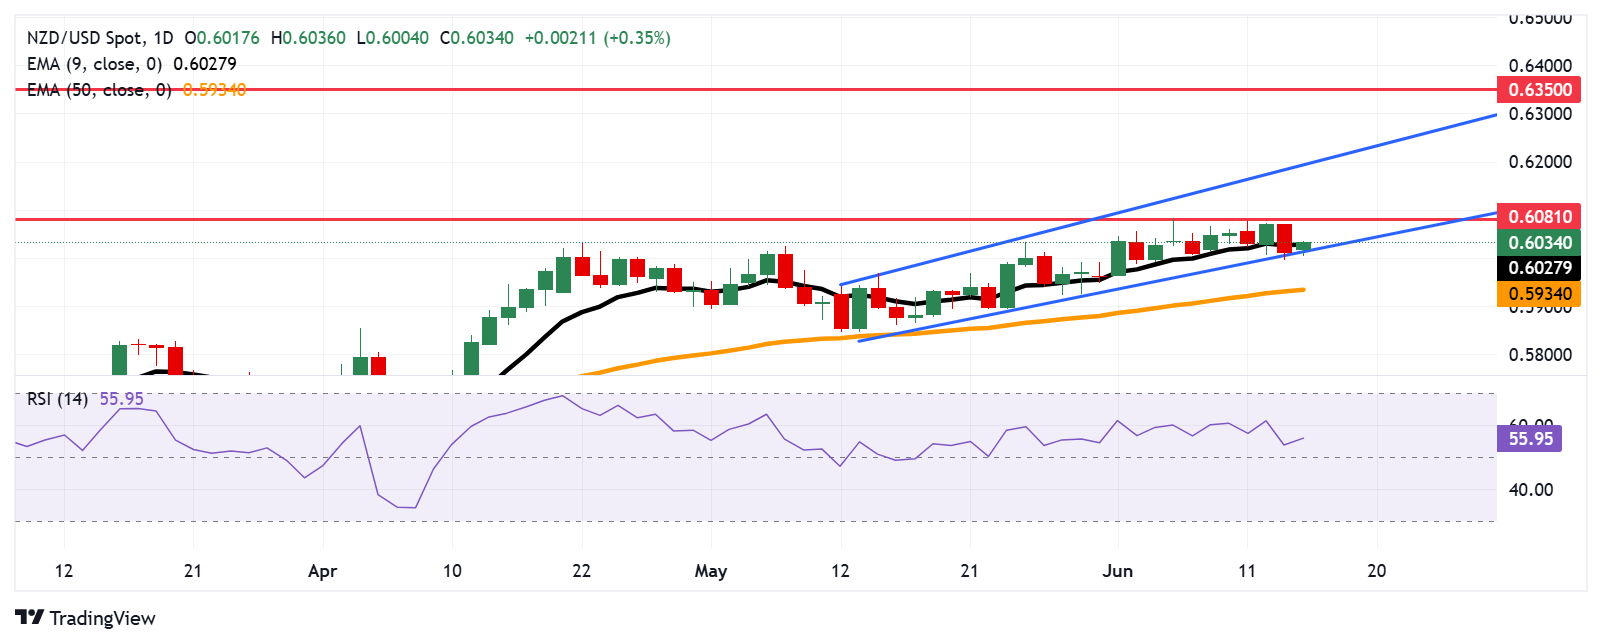
- The 14-day Relative Strength Index remains above the 50 mark, suggesting persistent bullish bias.
- The pair finds initial support at the ascending channel’s lower boundary around 0.6010.

NZD/USD is retracing its recent losses, trading around 0.6030 during the European hours on Monday. The technical analysis of the daily chart suggests that the bullish bias is prevailing as the pair remains within an ascending channel pattern.
The short-term price momentum is stronger as the NZD/USD pair is positioned slightly above the nine-day Exponential Moving Average (EMA). Additionally, the bullish bias strengthens as the 14-day Relative Strength Index (RSI) is remaining above the 50 mark.
The NZD/USD pair may target the eight-month high of 0.6081, which was reached on June 5. Further advances above this level may strengthen the bullish bias and support the pair to test the upper boundary of the ascending channel around 0.6200. A break above the channel could reinforce the bullish sentiment and support the pair to explore the region around the eight-month high of 0.6350, marked in October 2024.
On the downside, the nine-day EMA at 0.6027 is acting as the immediate support, followed by the ascending channel’s lower boundary around 0.6010. A break below the channel could weaken the bullish bias and put downward pressure on the NZD/USD pair to approach the 50-day EMA at 0.5930.
NZD/USD: Daily Chart
New Zealand Dollar PRICE Today
The table below shows the percentage change of New Zealand Dollar (NZD) against listed major currencies today. New Zealand Dollar was the strongest against the Japanese Yen.
| USD | EUR | GBP | JPY | CAD | AUD | NZD | CHF | |
|---|---|---|---|---|---|---|---|---|
| USD | -0.38% | -0.17% | -0.27% | -0.08% | -0.40% | -0.24% | 0.05% | |
| EUR | 0.38% | 0.10% | 0.08% | 0.31% | 0.10% | 0.15% | 0.44% | |
| GBP | 0.17% | -0.10% | 0.04% | 0.21% | 0.00% | 0.05% | 0.33% | |
| JPY | 0.27% | -0.08% | -0.04% | 0.18% | -0.45% | -0.34% | -0.10% | |
| CAD | 0.08% | -0.31% | -0.21% | -0.18% | -0.25% | -0.16% | 0.12% | |
| AUD | 0.40% | -0.10% | -0.00% | 0.45% | 0.25% | 0.05% | 0.33% | |
| NZD | 0.24% | -0.15% | -0.05% | 0.34% | 0.16% | -0.05% | 0.28% | |
| CHF | -0.05% | -0.44% | -0.33% | 0.10% | -0.12% | -0.33% | -0.28% |
The heat map shows percentage changes of major currencies against each other. The base currency is picked from the left column, while the quote currency is picked from the top row. For example, if you pick the New Zealand Dollar from the left column and move along the horizontal line to the US Dollar, the percentage change displayed in the box will represent NZD (base)/USD (quote).
Author

Akhtar Faruqui
FXStreet
Akhtar Faruqui is a Forex Analyst based in New Delhi, India. With a keen eye for market trends and a passion for dissecting complex financial dynamics, he is dedicated to delivering accurate and insightful Forex news and analysis.


