NZD/USD Price Forecast: Moves above 0.6350, barrier appears around 15-month highs
- NZD/USD may approach its 15-month high of 0.6409 level.
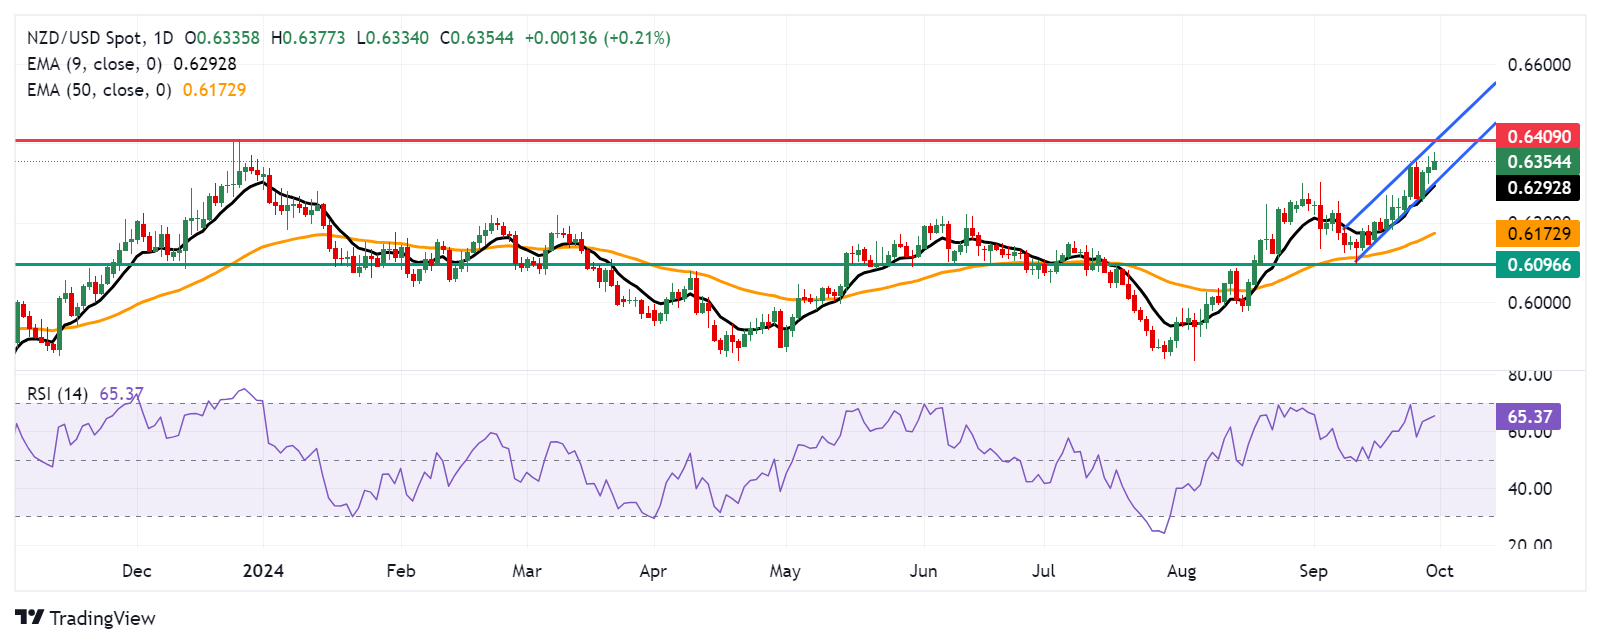
- The analysis of a daily chart suggests an ongoing bullish bias for the pair.
- A nine-day EMA at 0.6293 appears as the support, which is aligned with the lower boundary of the ascending channel.

NZD/USD extends its winning streak for the third successive day, trading around 0.6360 during the early European hours on Monday. On the daily chart, the pair is moving upward within the ascending channel pattern, suggesting an ongoing bullish bias.
Additionally, the 14-day Relative Strength Index (RSI) remains above the 50 level, confirming an ongoing bullish sentiment. The RSI may appreciate toward the 70 mark, suggesting a potential for further gains.
Additionally, the nine-day Exponential Moving Average (EMA) is positioned above the 50-day EMA, suggesting the short-term price trend is stronger for the NZD/USD pair.
On the upside, the NZD/USD pair may explore the area around its 15-month high of 0.6409 level, recorded in December 2023, aligned with the upper boundary of the ascending channel.
In terms of support, the NZD/USD pair may test the nine-day Exponential Moving Average (EMA) at the 0.6292 level, aligned with the lower boundary of the ascending channel.
A break below the ascending channel could weaken the bullish bias and put pressure on the NZD/USD pair to test the 50-day EMA at 0.6172 level, followed by the five-week low of 0.6096 level.
NZD/USD: Daily Chart
New Zealand Dollar PRICE Today
The table below shows the percentage change of New Zealand Dollar (NZD) against listed major currencies today. New Zealand Dollar was the strongest against the Swiss Franc.
| USD | EUR | GBP | JPY | CAD | AUD | NZD | CHF | |
|---|---|---|---|---|---|---|---|---|
| USD | -0.17% | -0.14% | 0.09% | 0.06% | -0.32% | -0.31% | 0.25% | |
| EUR | 0.17% | 0.03% | 0.27% | 0.26% | -0.09% | -0.12% | 0.50% | |
| GBP | 0.14% | -0.03% | 0.34% | 0.22% | -0.12% | -0.15% | 0.47% | |
| JPY | -0.09% | -0.27% | -0.34% | 0.04% | -0.45% | -0.36% | 0.23% | |
| CAD | -0.06% | -0.26% | -0.22% | -0.04% | -0.33% | -0.37% | 0.25% | |
| AUD | 0.32% | 0.09% | 0.12% | 0.45% | 0.33% | -0.03% | 0.59% | |
| NZD | 0.31% | 0.12% | 0.15% | 0.36% | 0.37% | 0.03% | 0.60% | |
| CHF | -0.25% | -0.50% | -0.47% | -0.23% | -0.25% | -0.59% | -0.60% |
The heat map shows percentage changes of major currencies against each other. The base currency is picked from the left column, while the quote currency is picked from the top row. For example, if you pick the New Zealand Dollar from the left column and move along the horizontal line to the US Dollar, the percentage change displayed in the box will represent NZD (base)/USD (quote).
Author

Akhtar Faruqui
FXStreet
Akhtar Faruqui is a Forex Analyst based in New Delhi, India. With a keen eye for market trends and a passion for dissecting complex financial dynamics, he is dedicated to delivering accurate and insightful Forex news and analysis.


