NZD/USD Price Forecast: Finds immediate barrier at nine-day EMA near 0.5650
- NZD/USD tests the immediate resistance at a nine-day EMA of 0.5654.
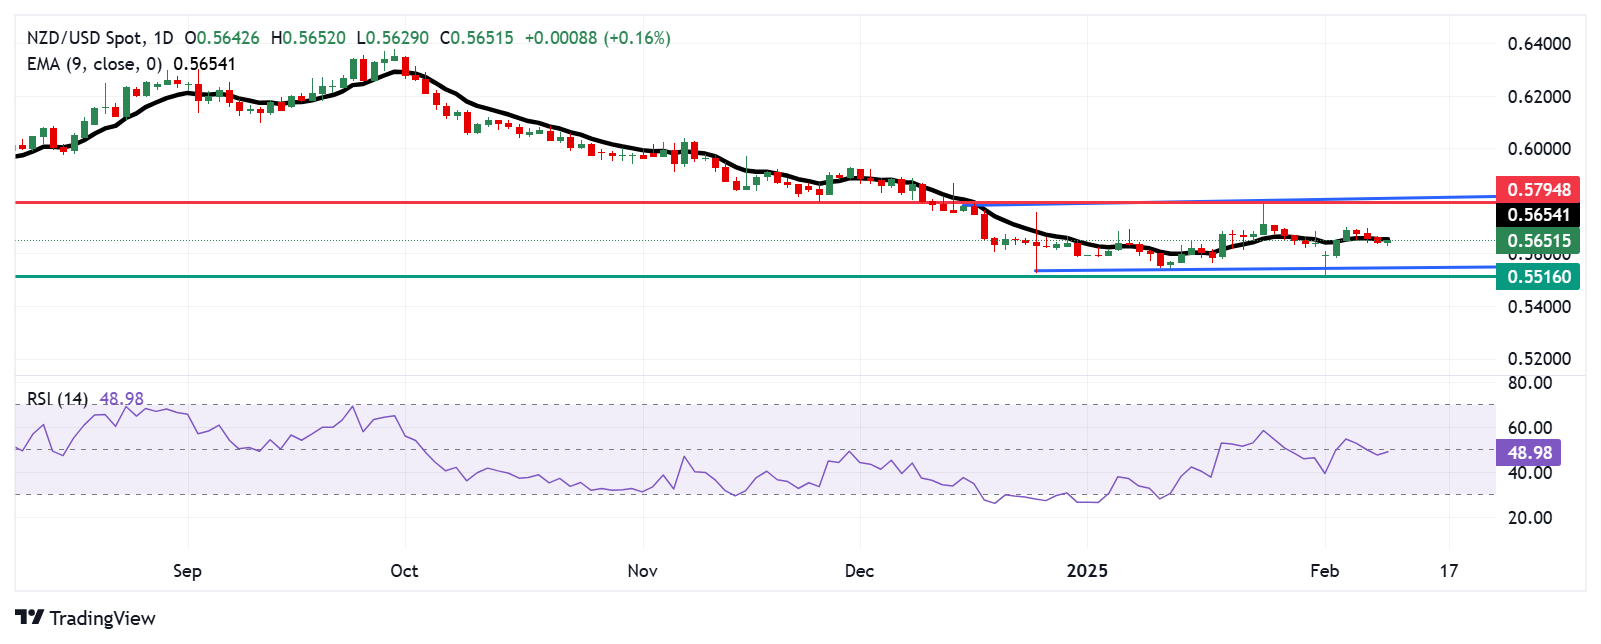
- The 14-day RSI is positioned below the 50 level, suggesting a bearish bias is active.
- A successful break below 0.5650 could lead the pair to approach the rectangle’s lower boundary at the 0.5550 level.

The NZD/USD pair breaks its three-day losing streak, trading around 0.5650 during the early European hours on Tuesday. The technical analysis of the daily chart indicates that buyers and sellers are unsure of the long-term direction of the asset as the pair consolidates within a rectangular pattern.
Additionally, the 14-day Relative Strength Index (RSI) is positioned slightly below the 50 level, suggesting a bearish bias is active. However, the NZD/USD pair remains slightly below the nine-day Exponential Moving Average (EMA), reflecting that short-term price momentum is also dampened.
Regarding its support, the NZD/USD pair tests a crucial level of 0.5650. A successful break below this level could lead the pair to navigate the region around the lower threshold of the rectangle at the 0.5550 level, followed by its support area at 0.5516—its lowest point since October 2022, reached on February 3.
On the upside, the NZD/USD pair tests the nine-day EMA at 0.5654. A break above this level could improve the short-term price momentum and support the pair to navigate the area around its nine-week high of 0.5794, reached on January 24. The further barrier appears at the psychological level of 0.5800, followed by the upper threshold of the rectangle at 0.5810.
NZD/USD: Daily Chart
New Zealand Dollar PRICE Today
The table below shows the percentage change of New Zealand Dollar (NZD) against listed major currencies today. New Zealand Dollar was the strongest against the British Pound.
| USD | EUR | GBP | JPY | CAD | AUD | NZD | CHF | |
|---|---|---|---|---|---|---|---|---|
| USD | 0.02% | 0.18% | 0.06% | 0.14% | -0.05% | -0.13% | 0.04% | |
| EUR | -0.02% | 0.14% | 0.00% | 0.12% | -0.07% | -0.15% | 0.02% | |
| GBP | -0.18% | -0.14% | -0.13% | -0.03% | -0.23% | -0.30% | -0.13% | |
| JPY | -0.06% | 0.00% | 0.13% | 0.10% | -0.09% | -0.17% | 0.00% | |
| CAD | -0.14% | -0.12% | 0.03% | -0.10% | -0.19% | -0.27% | -0.10% | |
| AUD | 0.05% | 0.07% | 0.23% | 0.09% | 0.19% | -0.08% | 0.09% | |
| NZD | 0.13% | 0.15% | 0.30% | 0.17% | 0.27% | 0.08% | 0.17% | |
| CHF | -0.04% | -0.02% | 0.13% | -0.01% | 0.10% | -0.09% | -0.17% |
The heat map shows percentage changes of major currencies against each other. The base currency is picked from the left column, while the quote currency is picked from the top row. For example, if you pick the New Zealand Dollar from the left column and move along the horizontal line to the US Dollar, the percentage change displayed in the box will represent NZD (base)/USD (quote).
Author

Akhtar Faruqui
FXStreet
Akhtar Faruqui is a Forex Analyst based in New Delhi, India. With a keen eye for market trends and a passion for dissecting complex financial dynamics, he is dedicated to delivering accurate and insightful Forex news and analysis.


