NZD/USD Price Forecast: Falls toward descending channel's lower boundary near 0.5900
- NZD/USD may approach the lower boundary of the descending channel pattern near 0.5900.
- An upward correction would be indicated if the 14-day RSI breaks below the 30 mark.
- The nine-day EMA at 0.5979 level may act as the immediate resistance.

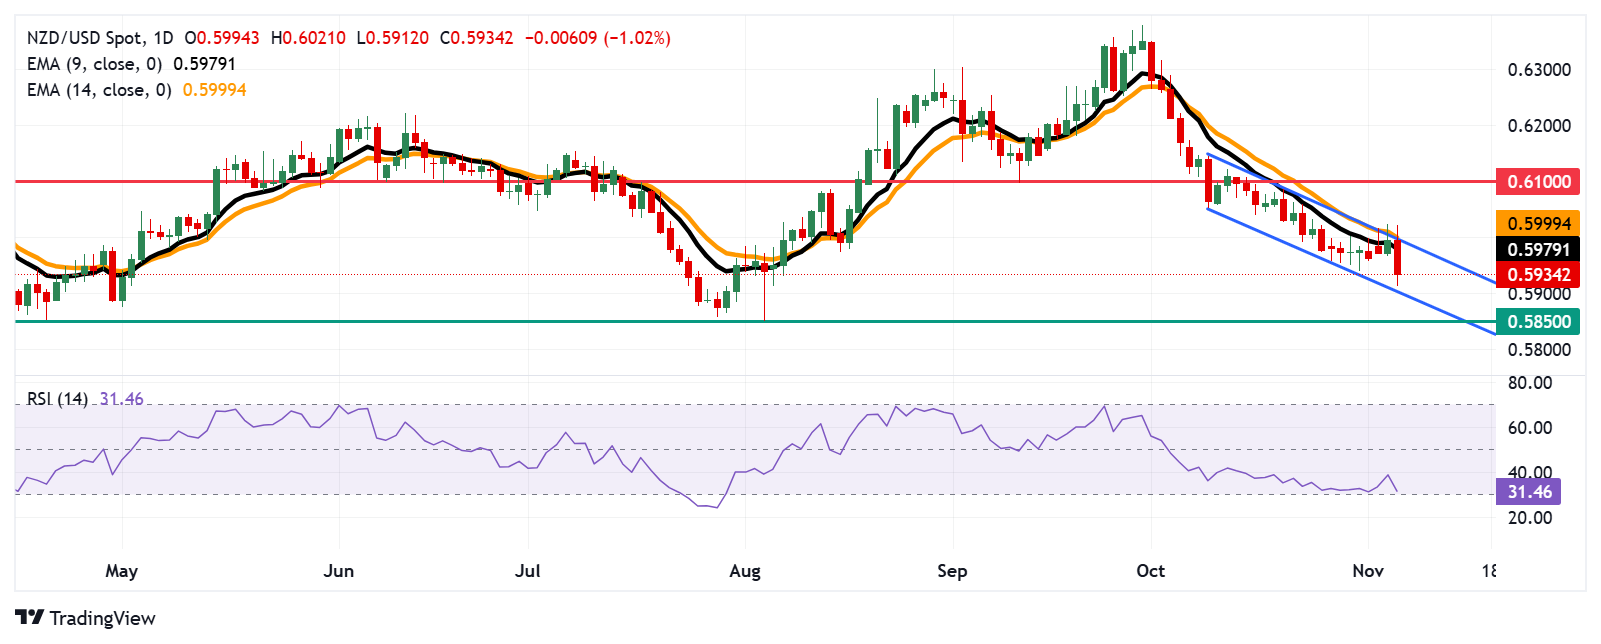
The NZD/USD pair loses ground to near 0.5930 during Wednesday's early European session. Daily chart analysis indicates a bearish bias, with the pair positioning within a descending channel.
However, the 14-day Relative Strength Index (RSI), a key momentum indicator, approaches the 30 level. A break below the 30 mark would indicate an oversold situation for the NZD/USD pair and an upward correction in the near future.
Adding to this outlook, the nine-day Exponential Moving Average (EMA) remains below the 14-day EMA, suggesting a weakness in the trend for the NZD/USD pair.
On the downside, NZD/USD may find its support around the lower boundary of the descending channel near 0.5910, followed by the psychological level of 0.5900 level.
A break below the latter could put downward pressure on the NZD/USD pair to navigate the region around the throwback support at the 0.5850 level.
On the resistance side, the NZD/USD may test the nine-day EMA at 0.5977 level, followed by the upper boundary of the descending channel near the 14-day EMA at 0.5999 level.
A breakthrough above the descending channel pattern would cause the emergence of the bullish bias and support the NZD/USD pair to explore the region around the psychological level of 0.6100.
NZD/USD: Daily Chart
New Zealand Dollar PRICE Today
The table below shows the percentage change of New Zealand Dollar (NZD) against listed major currencies today. New Zealand Dollar was the weakest against the US Dollar.
| USD | EUR | GBP | JPY | CAD | AUD | NZD | CHF | |
|---|---|---|---|---|---|---|---|---|
| USD | 1.75% | 1.27% | 1.60% | 0.61% | 1.32% | 1.01% | 1.19% | |
| EUR | -1.75% | -0.46% | -0.15% | -1.11% | -0.41% | -0.72% | -0.54% | |
| GBP | -1.27% | 0.46% | 0.28% | -0.65% | 0.05% | -0.26% | -0.08% | |
| JPY | -1.60% | 0.15% | -0.28% | -0.96% | -0.26% | -0.59% | -0.39% | |
| CAD | -0.61% | 1.11% | 0.65% | 0.96% | 0.71% | 0.39% | 0.58% | |
| AUD | -1.32% | 0.41% | -0.05% | 0.26% | -0.71% | -0.32% | -0.12% | |
| NZD | -1.01% | 0.72% | 0.26% | 0.59% | -0.39% | 0.32% | 0.19% | |
| CHF | -1.19% | 0.54% | 0.08% | 0.39% | -0.58% | 0.12% | -0.19% |
The heat map shows percentage changes of major currencies against each other. The base currency is picked from the left column, while the quote currency is picked from the top row. For example, if you pick the New Zealand Dollar from the left column and move along the horizontal line to the US Dollar, the percentage change displayed in the box will represent NZD (base)/USD (quote).
Author

Akhtar Faruqui
FXStreet
Akhtar Faruqui is a Forex Analyst based in New Delhi, India. With a keen eye for market trends and a passion for dissecting complex financial dynamics, he is dedicated to delivering accurate and insightful Forex news and analysis.


