NZD/USD Price Forecast: Falls toward 0.5950 within the descending channel
- NZD/USD continues to depreciate within the descending channel pattern, suggesting a bearish bias.
- A drop in the 14-day RSI to the 30 level would indicate an oversold condition, potentially signaling an upcoming upward correction.
- The immediate barrier appears at the lower boundary of the descending channel near the 0.5940 level.

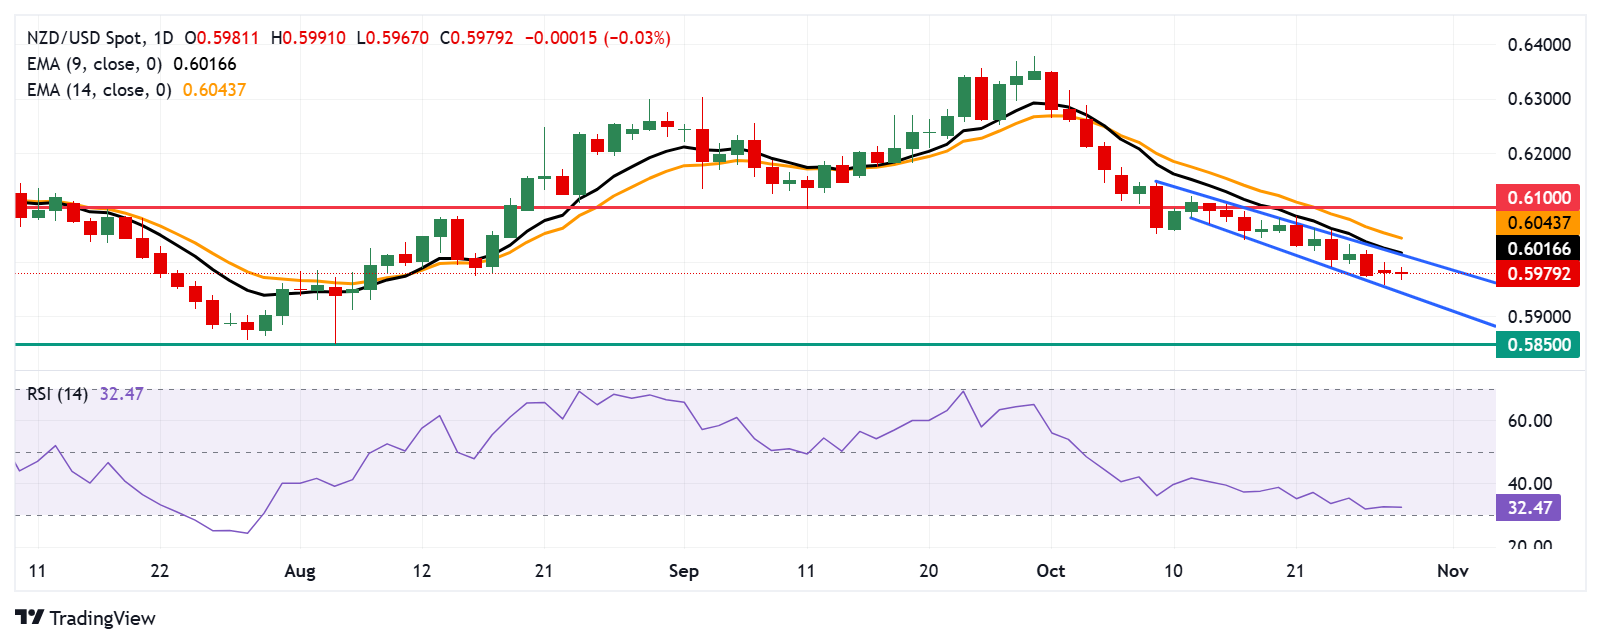
The NZD/USD pair continues its losing streak for a third consecutive session, trading near 0.5980 during Tuesday's European session. Daily chart analysis indicates the pair moves downward within a descending channel pattern, signaling a bearish bias.
Furthermore, the nine-day Exponential Moving Average (EMA) is positioned below the 14-day EMA, reinforcing the ongoing bearish trend for the NZD/USD pair. Short-term price momentum remains weak, suggesting that downward pressure may persist.
The 14-day Relative Strength Index (RSI), a key momentum indicator, currently sits just above the 30 level. Should it fall below this threshold, it would indicate an oversold condition, potentially signaling a forthcoming upward correction for the NZD/USD pair.
On the downside, the NZD/USD pair may target the lower boundary of the descending channel near the 0.5940 level. A break below this support level could push the pair toward the "pullback support" around 0.5850.
For resistance, the initial hurdle lies at the upper boundary of the descending channel, near the nine-day Exponential Moving Average (EMA) around 0.6016, followed by the 14-day EMA at 0.6043. A sustained break above these EMAs could shift the pair toward a short-term bullish bias, potentially setting up a move toward the psychological 0.6100 level.
NZD/USD: Daily Chart
New Zealand Dollar PRICE Today
The table below shows the percentage change of New Zealand Dollar (NZD) against listed major currencies today. New Zealand Dollar was the weakest against the British Pound.
| USD | EUR | GBP | JPY | CAD | AUD | NZD | CHF | |
|---|---|---|---|---|---|---|---|---|
| USD | -0.04% | -0.08% | 0.06% | -0.07% | 0.10% | 0.04% | 0.10% | |
| EUR | 0.04% | -0.04% | 0.10% | -0.03% | 0.13% | 0.08% | 0.18% | |
| GBP | 0.08% | 0.04% | 0.14% | 0.01% | 0.17% | 0.11% | 0.22% | |
| JPY | -0.06% | -0.10% | -0.14% | -0.13% | 0.05% | -0.03% | 0.09% | |
| CAD | 0.07% | 0.03% | -0.01% | 0.13% | 0.17% | 0.11% | 0.21% | |
| AUD | -0.10% | -0.13% | -0.17% | -0.05% | -0.17% | -0.06% | 0.00% | |
| NZD | -0.04% | -0.08% | -0.11% | 0.03% | -0.11% | 0.06% | 0.08% | |
| CHF | -0.10% | -0.18% | -0.22% | -0.09% | -0.21% | -0.01% | -0.08% |
The heat map shows percentage changes of major currencies against each other. The base currency is picked from the left column, while the quote currency is picked from the top row. For example, if you pick the New Zealand Dollar from the left column and move along the horizontal line to the US Dollar, the percentage change displayed in the box will represent NZD (base)/USD (quote).
Author

Akhtar Faruqui
FXStreet
Akhtar Faruqui is a Forex Analyst based in New Delhi, India. With a keen eye for market trends and a passion for dissecting complex financial dynamics, he is dedicated to delivering accurate and insightful Forex news and analysis.


