NZD/USD Price Forecast: Drops to near 0.5550 within the oversold territory
- NZD/USD could test the descending channel’s lower boundary at 0.5540 level.
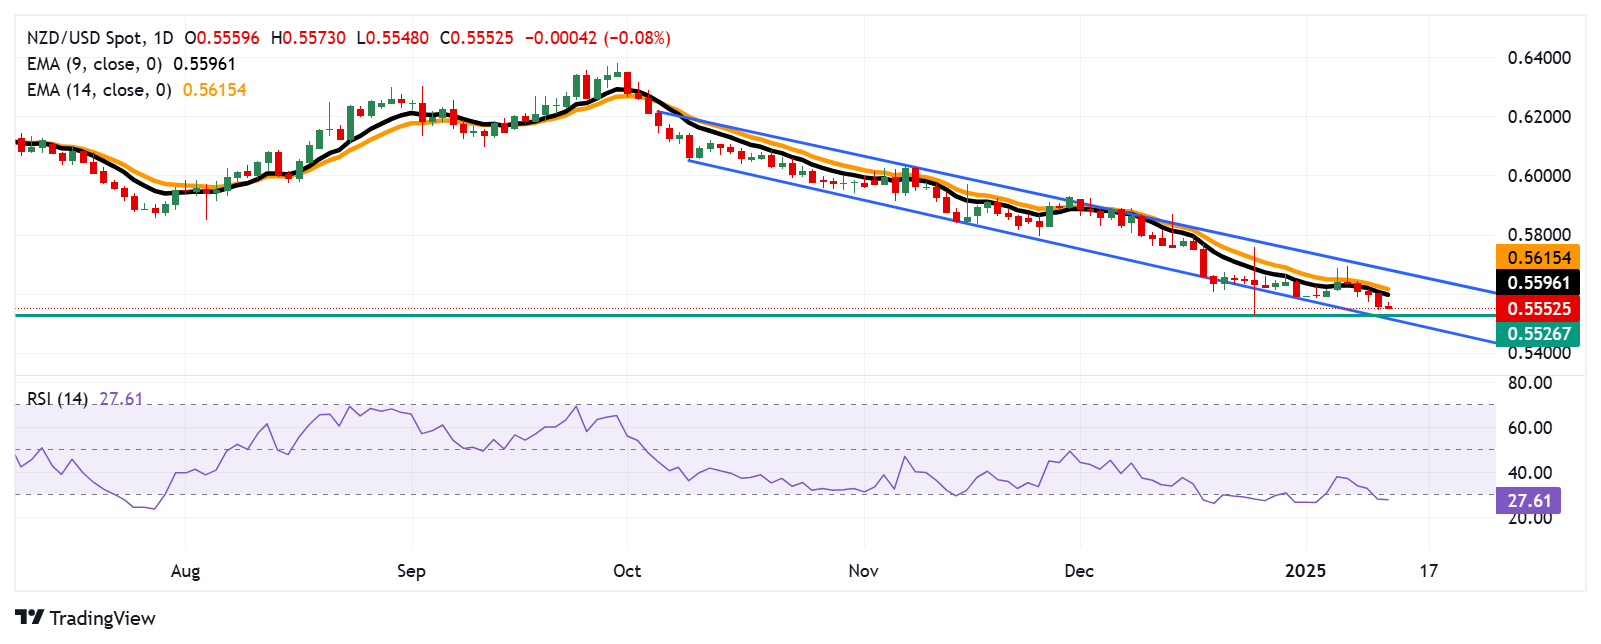
- The 14-day RSI remains below the 30 level, suggesting a bullish divergence.
- The initial resistance appears around the nine-day EMA at the 0.5596 level.

The NZD/USD pair continues its losing streak that began on January 7, trading around 0.5550 during the European hours on Monday. The technical analysis of the daily chart indicates a persistent bearish bias as the pair trades near the lower boundary of a descending channel.
The 14-day Relative Strength Index (RSI) remains below the 30 level, signaling oversold conditions that may prompt a corrective bounce. However, if the RSI continues to hover near the 30 mark, it could further strengthen bearish sentiment.
Additionally, the NZD/USD pair remains below the 14- and nine-day Exponential Moving Averages (EMAs), reflecting weak short-term price momentum and suggesting that downward pressure is likely to persist.
Regarding its support, the NZD/USD pair trades near the lower edge of its descending channel at the 0.5540 level, with the next support at 0.5526—its lowest point since October 2022, reached on December 25.
The NZD/USD pair may find its initial resistance at the nine-day EMA at 0.5596 level, followed by the 14-day EMA at 0.5615 level. A break above this level could improve the short-term price momentum and support the pair to test the descending channel’s upper boundary at the psychological level of 0.5700 level.
NZD/USD: Daily Chart
New Zealand Dollar PRICE Today
The table below shows the percentage change of New Zealand Dollar (NZD) against listed major currencies today. New Zealand Dollar was the weakest against the Japanese Yen.
| USD | EUR | GBP | JPY | CAD | AUD | NZD | CHF | |
|---|---|---|---|---|---|---|---|---|
| USD | 0.22% | 0.62% | -0.28% | -0.04% | -0.07% | 0.10% | -0.15% | |
| EUR | -0.22% | 0.39% | -0.43% | -0.19% | -0.14% | -0.06% | -0.29% | |
| GBP | -0.62% | -0.39% | -0.82% | -0.58% | -0.52% | -0.44% | -0.67% | |
| JPY | 0.28% | 0.43% | 0.82% | 0.24% | 0.15% | 0.24% | 0.14% | |
| CAD | 0.04% | 0.19% | 0.58% | -0.24% | -0.07% | 0.12% | -0.04% | |
| AUD | 0.07% | 0.14% | 0.52% | -0.15% | 0.07% | 0.04% | -0.15% | |
| NZD | -0.10% | 0.06% | 0.44% | -0.24% | -0.12% | -0.04% | -0.23% | |
| CHF | 0.15% | 0.29% | 0.67% | -0.14% | 0.04% | 0.15% | 0.23% |
The heat map shows percentage changes of major currencies against each other. The base currency is picked from the left column, while the quote currency is picked from the top row. For example, if you pick the New Zealand Dollar from the left column and move along the horizontal line to the US Dollar, the percentage change displayed in the box will represent NZD (base)/USD (quote).
Author

Akhtar Faruqui
FXStreet
Akhtar Faruqui is a Forex Analyst based in New Delhi, India. With a keen eye for market trends and a passion for dissecting complex financial dynamics, he is dedicated to delivering accurate and insightful Forex news and analysis.


