NZD/USD Price Forecast: Could break below 50-day EMA toward 0.5700 support
- NZD/USD may face immediate resistance at the nine-day EMA of 0.5737.
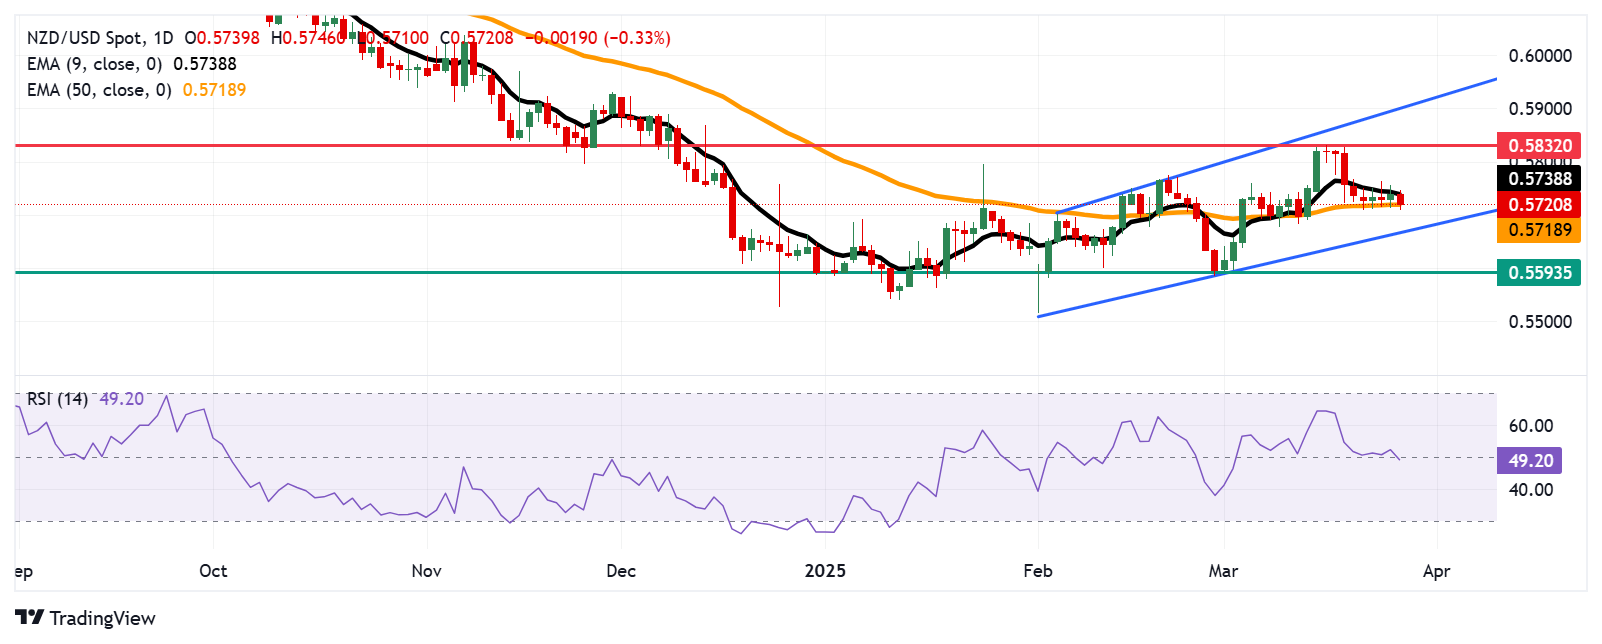
- The 14-day RSI has fallen below the 50 mark, indicating weakening bullish momentum.
- A drop below the 50-day EMA at 0.5718 could further erode medium-term strength.

The NZD/USD pair retraced its recent gains from the previous session, hovering around 0.5720 during early European trading on Friday. The technical analysis of the daily chart suggests a bullish bias as the pair remains within an ascending channel pattern. However, the 14-day Relative Strength Index (RSI) has dipped below the 50 level, signaling a weakening bullish momentum.
Additionally, the NZD/USD pair remains below the nine-day Exponential Moving Average (EMA), suggesting weakening short-term price momentum. However, with the nine-day EMA still positioned above the 50-day EMA, the broader bullish trend remains intact, indicating the potential for continued recovery.
On the upside, a decisive break above the nine-day EMA at 0.5738 could bolster short-term momentum, potentially pushing the NZD/USD pair toward its three-month high of 0.5832, last reached on March 18. Beyond this level, the next key resistance lies near the upper boundary of the ascending channel, around 0.5900.
A break below the 50-day EMA at 0.5718 could weaken medium-term momentum, intensifying downside pressure on the NZD/USD pair. This could lead to a test of the psychological support at 0.5700, with the lower boundary of the ascending channel near 0.5670 as the next key level. A breakdown below this channel would reinforce the bearish bias, potentially driving the pair toward the monthly low of 0.5593, recorded on March 3.
NZD/USD: Daily Chart
New Zealand Dollar PRICE Today
The table below shows the percentage change of New Zealand Dollar (NZD) against listed major currencies today. New Zealand Dollar was the weakest against the Japanese Yen.
| USD | EUR | GBP | JPY | CAD | AUD | NZD | CHF | |
|---|---|---|---|---|---|---|---|---|
| USD | 0.13% | 0.04% | -0.26% | 0.14% | 0.30% | 0.47% | 0.06% | |
| EUR | -0.13% | -0.12% | -0.44% | -0.01% | 0.14% | 0.32% | -0.09% | |
| GBP | -0.04% | 0.12% | -0.31% | 0.11% | 0.26% | 0.44% | 0.02% | |
| JPY | 0.26% | 0.44% | 0.31% | 0.40% | 0.56% | 0.74% | 0.33% | |
| CAD | -0.14% | 0.01% | -0.11% | -0.40% | 0.15% | 0.32% | -0.08% | |
| AUD | -0.30% | -0.14% | -0.26% | -0.56% | -0.15% | 0.17% | -0.24% | |
| NZD | -0.47% | -0.32% | -0.44% | -0.74% | -0.32% | -0.17% | -0.41% | |
| CHF | -0.06% | 0.09% | -0.02% | -0.33% | 0.08% | 0.24% | 0.41% |
The heat map shows percentage changes of major currencies against each other. The base currency is picked from the left column, while the quote currency is picked from the top row. For example, if you pick the New Zealand Dollar from the left column and move along the horizontal line to the US Dollar, the percentage change displayed in the box will represent NZD (base)/USD (quote).
Author

Akhtar Faruqui
FXStreet
Akhtar Faruqui is a Forex Analyst based in New Delhi, India. With a keen eye for market trends and a passion for dissecting complex financial dynamics, he is dedicated to delivering accurate and insightful Forex news and analysis.


