NZD/USD Price Forecast: Bounces off 0.5950 near ascending channel’s lower boundary


  • NZD/USD may test the key resistance at 0.6038 — a six-month high last reached in November 2024.
  • Daily chart analysis suggests a bullish bias, highlighted by the presence of an ascending channel pattern.
  • Initial support lies near the lower boundary of this channel, around 0.5940.

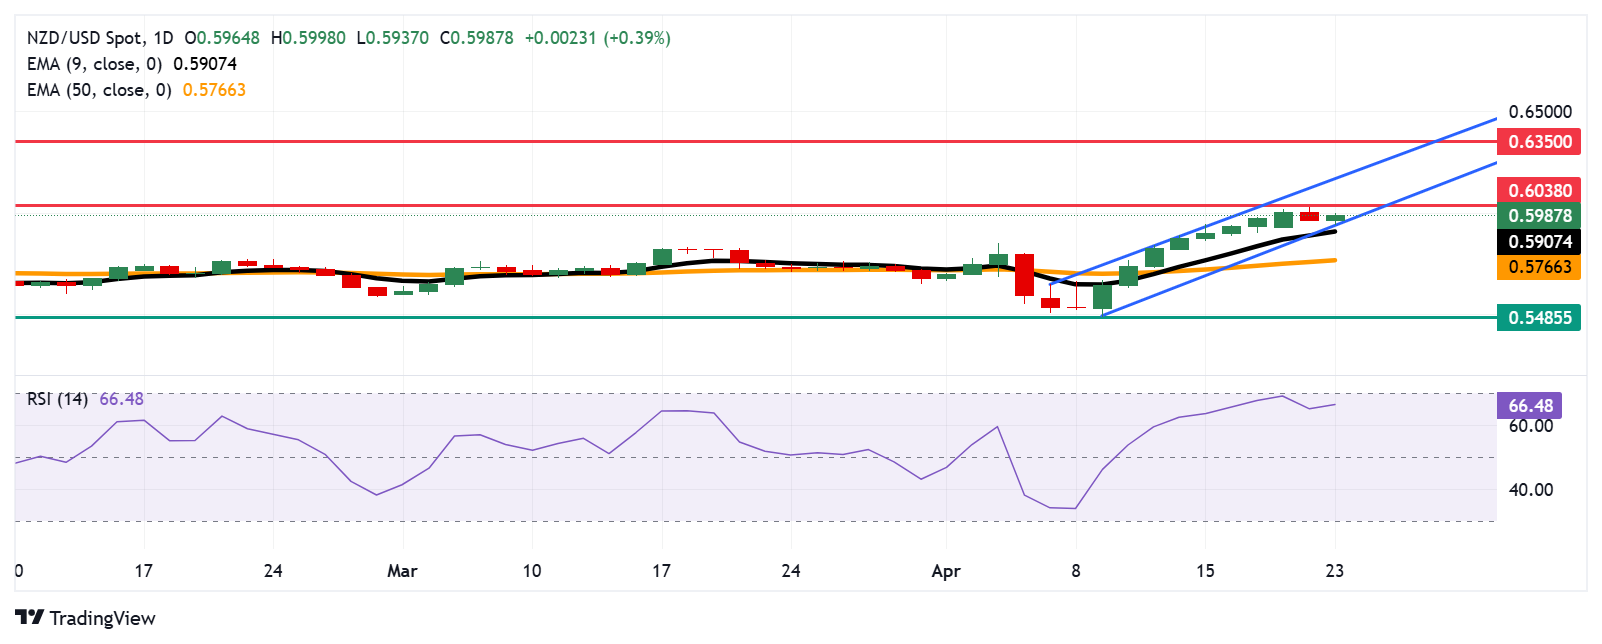
The NZD/USD pair recovers its recent losses registered in the previous session, trading around 0.6000 during early European trading hours on Wednesday. Technical analysis on the daily chart indicates a bullish bias, with the formation of an ascending channel pattern. Moreover, the pair remains above the nine-day Exponential Moving Average (EMA), signaling improved short-term price momentum.

Moreover, the 14-day Relative Strength Index (RSI) is climbing back toward the 70 mark, reinforcing the prevailing bullish bias. A decisive move above this level could indicate overbought conditions, potentially increasing the risk of a short-term pullback.

On the upside, the NZD/USD pair could challenge the key resistance at the six-month high of 0.6038, last seen in November 2024. A sustained break above this level would pave the way for a move toward the upper boundary of the ascending channel around 0.6190. A successful breach of this resistance would likely reinforce the bullish outlook and potentially open the path toward the seven-month high near 0.6350, recorded in October 2024.

The initial support is located at the lower boundary of the ascending channel around 0.5940, followed by the nine-day EMA at 0.5907. A break below these levels could weaken the short-term bullish momentum and open the door for further downside toward the 50-day EMA at 0.5766. Additional support is seen at 0.5485—a level not visited since March 2020.

NZD/USD: Daily Chart

New Zealand Dollar PRICE Today

The table below shows the percentage change of New Zealand Dollar (NZD) against listed major currencies today. New Zealand Dollar was the strongest against the Swiss Franc.

USD EUR GBP JPY CAD AUD NZD CHF
USD 0.24% 0.09% -0.01% 0.04% -0.81% -0.40% 0.24%
EUR -0.24% -0.17% -0.24% -0.21% -0.99% -0.65% -0.01%
GBP -0.09% 0.17% -0.09% -0.05% -0.84% -0.48% 0.17%
JPY 0.01% 0.24% 0.09% 0.05% -0.68% -0.41% 0.27%
CAD -0.04% 0.21% 0.05% -0.05% -0.74% -0.41% 0.22%
AUD 0.81% 0.99% 0.84% 0.68% 0.74% 0.37% 1.03%
NZD 0.40% 0.65% 0.48% 0.41% 0.41% -0.37% 0.66%
CHF -0.24% 0.01% -0.17% -0.27% -0.22% -1.03% -0.66%

The heat map shows percentage changes of major currencies against each other. The base currency is picked from the left column, while the quote currency is picked from the top row. For example, if you pick the New Zealand Dollar from the left column and move along the horizontal line to the US Dollar, the percentage change displayed in the box will represent NZD (base)/USD (quote).

Share: Feed news

Information on these pages contains forward-looking statements that involve risks and uncertainties. Markets and instruments profiled on this page are for informational purposes only and should not in any way come across as a recommendation to buy or sell in these assets. You should do your own thorough research before making any investment decisions. FXStreet does not in any way guarantee that this information is free from mistakes, errors, or material misstatements. It also does not guarantee that this information is of a timely nature. Investing in Open Markets involves a great deal of risk, including the loss of all or a portion of your investment, as well as emotional distress. All risks, losses and costs associated with investing, including total loss of principal, are your responsibility. The views and opinions expressed in this article are those of the authors and do not necessarily reflect the official policy or position of FXStreet nor its advertisers. The author will not be held responsible for information that is found at the end of links posted on this page.

If not otherwise explicitly mentioned in the body of the article, at the time of writing, the author has no position in any stock mentioned in this article and no business relationship with any company mentioned. The author has not received compensation for writing this article, other than from FXStreet.

FXStreet and the author do not provide personalized recommendations. The author makes no representations as to the accuracy, completeness, or suitability of this information. FXStreet and the author will not be liable for any errors, omissions or any losses, injuries or damages arising from this information and its display or use. Errors and omissions excepted.

The author and FXStreet are not registered investment advisors and nothing in this article is intended to be investment advice.

Recommended content


Recommended content

Editors’ Picks

EUR/USD holds above 1.1300 despite weak EU PMI data

EUR/USD holds above 1.1300 despite weak EU PMI data

EUR/USD stays in a tight daily range above 1.1300 in the European session on Thursday. The PMI data from Germany and the Eurozone showed that the business activity in the private sector contracted in May, limiting the Euro's gains. Market focus shifts to US PMI data.

GBP/USD clings to minor gains above 1.3400 ahead of US PMI data

GBP/USD clings to minor gains above 1.3400 ahead of US PMI data

GBP/USD defends minor bids while trading above 1.3400 in the European session on Thursday. The data from the UK showed that S&P Global Composite PMI improved to 49.4 in May's flash estimate from 48.5 in April. Focus shifts to US PMI reports.

Gold price retreats further from two-week high; $3,300 mark holds the key for bulls

Gold price retreats further from two-week high; $3,300 mark holds the key for bulls

Gold price extends its steady intraday retracement slide from a nearly two-week high touched earlier this Thursday and slides to the lower end of its daily range during the first half of the European session. The pullback lacks any fundamental catalyst and is more likely to remain limited amid a combination of supporting factors.

Chainlink Price Forecast: LINK targets $25 amid rising whale activity 

Chainlink Price Forecast: LINK targets $25 amid rising whale activity 

Chainlink records a nearly 2% increase on Thursday, fuelled by the increased capital flow and risk-on sentiment. Whale activity in Chainlink has increased with 25 million LINK tokens added to their holdings since February. 

FOMO vs fundamentals: Retail buys the dip, institutional investors stay cautious

FOMO vs fundamentals: Retail buys the dip, institutional investors stay cautious

Retail optimism is rising, but institutions are still treading carefully amid lingering macro and earnings risks. Policy and fiscal uncertainty remain elevated, with trade tensions, U.S. debt concerns, and a cautious Fed dominating the backdrop.

The Best brokers to trade EUR/USD

The Best brokers to trade EUR/USD

SPONSORED Discover the top brokers for trading EUR/USD in 2025. Our list features brokers with competitive spreads, fast execution, and powerful platforms. Whether you're a beginner or an expert, find the right partner to navigate the dynamic Forex market.

Forex MAJORS

Cryptocurrencies

Signatures

Best Brokers of 2025