|

NZD/USD Price Analysis: Tumbles to three-day losses, below the 50-DMA

  • NZD/USD hits a new three-day nadir at 0.5906, shedding 0.39% amid a broader downtrend and declining US Treasury yields.
  • The pair faces immediate support at the psychological 0.5900 level, with further downside risks towards the September low and critical trendline supports.
  • A recovery above the 50-day moving average could open the path for the Kiwi to challenge resistances at 0.5900 and potentially the 0.6000 handle.

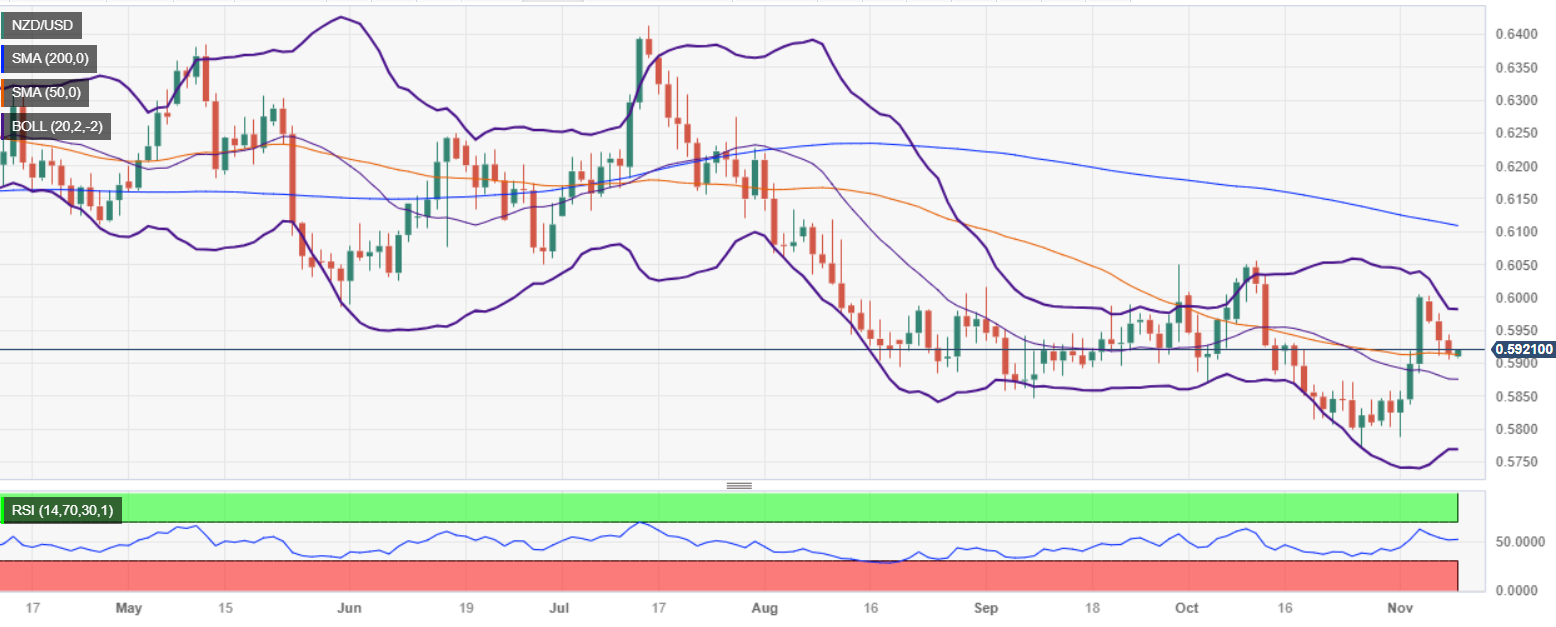
NZD/USD dives to a three-day low of 0.5906 below the 50-day moving average (DMA) at 0.5913, despite the Greenback (USD) trading unchanged as shown by the US Dollar Index (DXY), while US Treasury bond yields drop for the second consecutive day. The pair exchanges hands at 0.5910, down 0.39%.

The downtrend portrayed in the NZD/USD daily chart suggests the pair would continue to print losses unless the fundamentals change. Next, support is at 0.5900 in the figure, followed by the  September 5 low at 0.5859, followed by an upslope support trendline at 0.5815/25, before slumping to the 0.5800 mark. A breach of the latter would expose the year-to-date (YTD) low of 0.5773.

On the other hand, if NZD/USD buyers reclaim the 50-DMA, they could remain hopeful of testing higher prices. Next resistance is seen at 0.5900, before rallying to the 0.6000 mark.

NZD/USD Price Analysis – Daily Chart

NZD/USD Technical Levels

NZD/USD

Overview
Today last price0.5911
Today Daily Change-0.0024
Today Daily Change %-0.40
Today daily open0.5935
 
Trends
Daily SMA200.5881
Daily SMA500.5915
Daily SMA1000.6015
Daily SMA2000.6114
 
Levels
Previous Daily High0.5976
Previous Daily Low0.5911
Previous Weekly High0.6005
Previous Weekly Low0.5788
Previous Monthly High0.6056
Previous Monthly Low0.5772
Daily Fibonacci 38.2%0.5936
Daily Fibonacci 61.8%0.5951
Daily Pivot Point S10.5905
Daily Pivot Point S20.5876
Daily Pivot Point S30.584
Daily Pivot Point R10.597
Daily Pivot Point R20.6006
Daily Pivot Point R30.6035

Author

Christian Borjon Valencia

Markets analyst, news editor, and trading instructor with over 14 years of experience across FX, commodities, US equity indices, and global macro markets.

More from Christian Borjon Valencia
Share:

Editor's Picks

EUR/USD pops to yearly highs near 1.1770

EUR/USD rapidly reverses course and hits fresh YTD tops near 1.1780 at the end of the week. The pair’s U-turn comes on the back of the intense sell-off in the Greenback amid the generalised risk-on context.

GBP/USD climbs to four-month tops near 1.3600

GBP/USD is building on its solid weekly advance and is pushing toward the 1.3600 hurdle on Friday, or new four-month peaks. Cable’s strong move higher comes as the Greenback intensifies its decline, while auspicious results on the UK calendar also collaborate with the uptrend.

Gold picks up pace, approaches $5,000

Gold prices keep their uptrend well in place and gear up for an imminent hit to the key $5,000 mark per troy ounce on Friday. The yellow metal’s sharp advance gathers pace amid the increasing weakness in the US Dollar and mixed US Treasury yields across the curve.

Swiss bank UBS Group mulls Bitcoin and Ethereum offering for select private clients

UBS Group AG plans to offer crypto investment services to select private clients. The offering will allow clients of its private bank in Switzerland to buy and sell Bitcoin and Ethereum.

Week ahead – Fed and BoC meet amid geopolitical upheaval and Trump’s Fed pick

Fed to likely go on pause after three straight cuts. BoC is also expected to stand pat. But will Trump steal the limelight by revealing his Fed chair nomination?

Bitcoin slips below $90,000 as Trump's tariffs swing, ETF outflows pressure price

Bitcoin price struggles below $90,000 on Friday, correcting nearly 5% so far this week. Trump’s Davos speech on Wednesday, backing away from imposing further tariffs on the EU, triggered market volatility and risk-on mood.