NZD/USD Price Forecast: Remains above 0.6150, trends upwards within the ascending channel
- NZD/USD treks within the upper boundary of the ascending channel pattern.
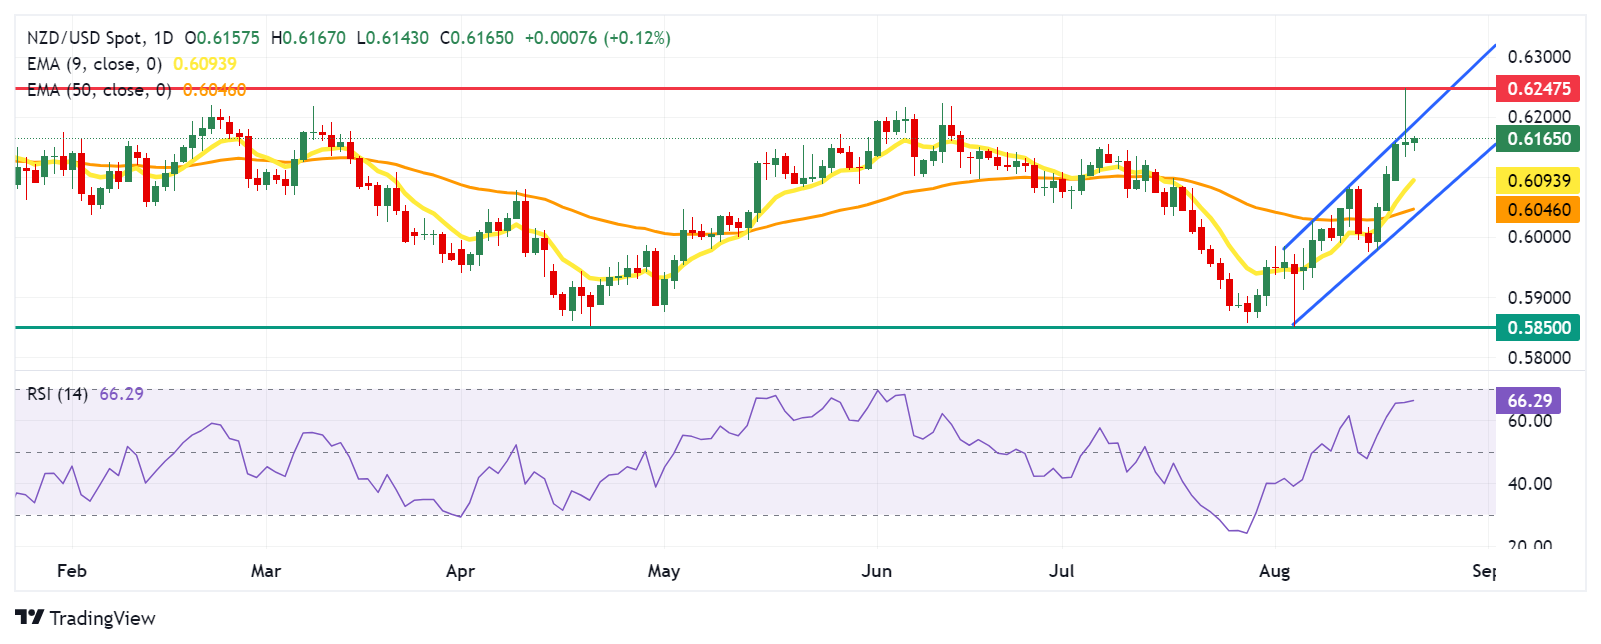
- The 14-day RSI rises to near 70 level, indicating a potential for correction.
- The nine-day EMA at 0.6092 appears as the immediate support for the pair.

NZD/USD continues its winning streak for the fifth successive session, trading around 0.6160 during the early European hours on Thursday. The daily chart analysis shows that the pair treks upwards within the upward boundary of the ascending channel, reinforcing the bullish bias.
Additionally, the 14-day Relative Strength Index (RSI) is positioned slightly below the 70 level, suggesting a confirmation of the bullish sentiment. Further movement will indicate currency pair overbought and a potential correction in the short term.
The nine-day Exponential Moving Average (EMA) is positioned above the 50-day EMA, indicating that the NZD/USD pair is experiencing upward momentum in the short term and continues to rise.
On the upside, the NZD/USD pair may find immediate resistance around the upper boundary of the ascending channel at 0.6190. A break above this level could lead the pair to test a two-month high of 0.6247 level, marked on Wednesday.
In terms of support, the nine-day EMA at 0.6092 appears as the immediate support. A break below this level could weaken the bullish bias and lead the NZD/USD pair to test the 50-day EMA at 0.6045 level, followed by the lower boundary of the ascending channel at 0.6030 level.
A breach below the latter could cause the emergence of a bearish sentiment, which may put pressure on the NZD/USD pair to navigate the region around “throwback support” at the 0.5850 level.
NZD/USD: Daily Chart
New Zealand Dollar PRICE Today
The table below shows the percentage change of New Zealand Dollar (NZD) against listed major currencies today. New Zealand Dollar was the strongest against the Euro.
| USD | EUR | GBP | JPY | CAD | AUD | NZD | CHF | |
|---|---|---|---|---|---|---|---|---|
| USD | 0.09% | -0.05% | -0.03% | -0.13% | -0.06% | -0.10% | -0.24% | |
| EUR | -0.09% | -0.15% | -0.16% | -0.24% | -0.15% | -0.22% | -0.33% | |
| GBP | 0.05% | 0.15% | -0.02% | -0.09% | -0.00% | -0.07% | -0.19% | |
| JPY | 0.03% | 0.16% | 0.02% | -0.18% | -0.03% | -0.09% | -0.22% | |
| CAD | 0.13% | 0.24% | 0.09% | 0.18% | 0.08% | 0.02% | -0.11% | |
| AUD | 0.06% | 0.15% | 0.00% | 0.03% | -0.08% | -0.05% | -0.19% | |
| NZD | 0.10% | 0.22% | 0.07% | 0.09% | -0.02% | 0.05% | -0.14% | |
| CHF | 0.24% | 0.33% | 0.19% | 0.22% | 0.11% | 0.19% | 0.14% |
The heat map shows percentage changes of major currencies against each other. The base currency is picked from the left column, while the quote currency is picked from the top row. For example, if you pick the New Zealand Dollar from the left column and move along the horizontal line to the US Dollar, the percentage change displayed in the box will represent NZD (base)/USD (quote).
Author

Akhtar Faruqui
FXStreet
Akhtar Faruqui is a Forex Analyst based in New Delhi, India. With a keen eye for market trends and a passion for dissecting complex financial dynamics, he is dedicated to delivering accurate and insightful Forex news and analysis.


