|

NZD/USD Price Analysis: Rebounds firmly above 0.6170 ahead of US/NZ Employment data

  • NZD/USD has shown a decent recovery above 0.6170 as USD Index has sensed selling pressure.
  • As per the consensus, the US economy added 150K jobs in April lower than the former additions of 145K.
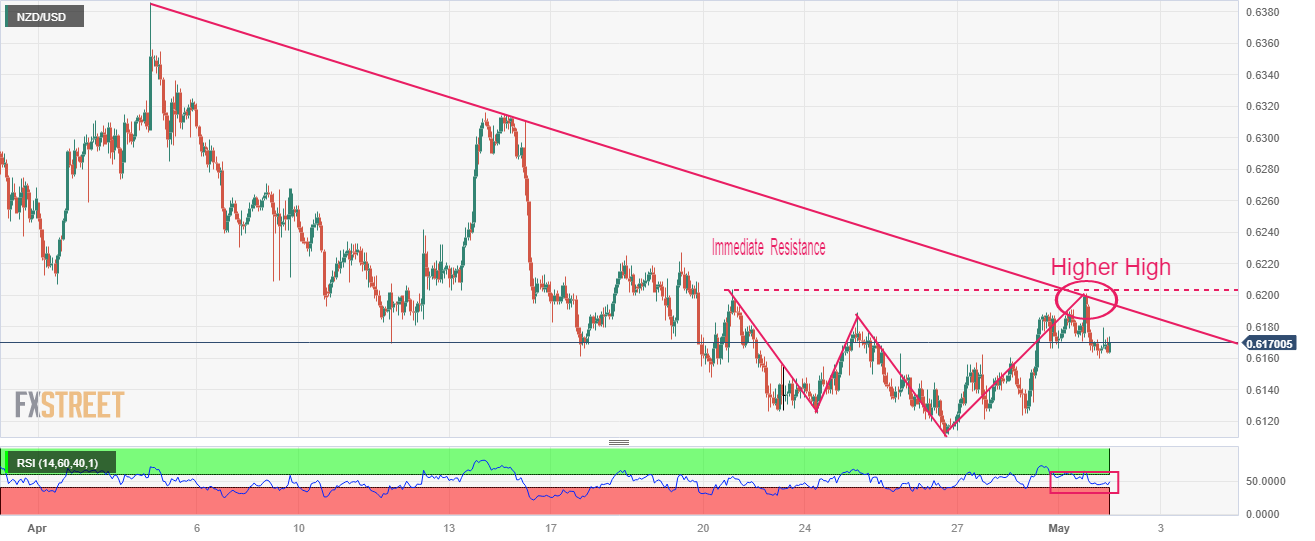
  • NZD/USD is continuously facing pressure near the downward-sloping trendline plotted from 0.6386.

The NZD/USD pair has scaled sharply above the immediate resistance of 0.6170 in the early Tokyo session. Earlier, the Kiwi asset witnessed an intense sell-off on Monday after failing to claim the round-level resistance of 0.6200.

The US Dollar Index (DXY) has sensed sheer selling pressure near its two-week-old resistance of 102.20. It seems that investors are digesting pre-Federal Reserve (Fed) policy anxiety.

Wednesday’s New Zealand and United States Employment data will be keenly watched. NZ’s Employment Change (Q1) is expected to remain steady at 0.2%. While the Unemployment Rate is seen rising to 3.5% from the former release of 3.4%.

On the US front, investors will keep an eye on Automatic Data Processing (ADP) Employment data. As per the consensus, the US economy added 150K jobs in April lower than the former additions of 145K.

NZD/USD is continuously facing pressure near the downward-sloping trendline plotted from April 05 high at 0.6386 on an hourly scale. The Kiwi asset has made a higher high after a lower high lower low structure, hinting for a potential bullish reversal ahead.

The New Zealand Dollar is facing immediate selling pressure near horizontal resistance placed from April 20 high at 0.6204.

Meanwhile, the Relative Strength Index (RSI) (14) has slipped back into the 40.00-60.00 range, indicating consolidation ahead.

Should the asset break above April 20 high at 0.6204, kiwi bulls will drive the asset towards April 19 high at 0.6227 followed by April 07 high at 0.6265.

In an alternate scenario, a breakdown of April 26 low at 0.6110 will drag the asset toward March 08 low at 0.6088 followed by the 15 Nov 2022 low at 0.6058.

NZD/USD hourly chart

NZD/USD

Overview
Today last price0.6172
Today Daily Change0.0006
Today Daily Change %0.10
Today daily open0.6166
 
Trends
Daily SMA200.6204
Daily SMA500.6207
Daily SMA1000.6285
Daily SMA2000.616
 
Levels
Previous Daily High0.6201
Previous Daily Low0.616
Previous Weekly High0.6189
Previous Weekly Low0.6111
Previous Monthly High0.6389
Previous Monthly Low0.6111
Daily Fibonacci 38.2%0.6176
Daily Fibonacci 61.8%0.6185
Daily Pivot Point S10.615
Daily Pivot Point S20.6135
Daily Pivot Point S30.6109
Daily Pivot Point R10.6191
Daily Pivot Point R20.6217
Daily Pivot Point R30.6232

Author

Sagar Dua

Sagar Dua

FXStreet

Sagar Dua is associated with the financial markets from his college days. Along with pursuing post-graduation in Commerce in 2014, he started his markets training with chart analysis.

More from Sagar Dua
Share:

Markets move fast. We move first.

Orange Juice Newsletter brings you expert driven insights - not headlines. Every day on your inbox.

By subscribing you agree to our Terms and conditions.

Editor's Picks

EUR/USD remains below 1.1700 amid weakening momentum

EUR/USD remains steady after four days of losses, trading around 1.1680 during the Asian hours on Thursday. On the daily chart, the 14-day Relative Strength Index at 42.6 (neutral-bearish) indicates weakening momentum after slipping below the 50 midline. RSI staying sub-50 would keep bears engaged and limit recovery attempts.

GBP/USD flat lines above 1.3450 as traders eye US jobs data

The GBP/USD pair trades on a flat note around 1.3465 during the early European trading hours on Thursday. Markets turn cautious as traders await the upcoming key US economic data this week. The weekly US Initial Jobless Claims report is due later in the day ahead of the highly anticipated Nonfarm Payrolls reading. 

Gold selling pressure persists as traders lock in profits ahead of US NFP report

Gold remains under some selling pressure for the second straight day and slides back closer to the overnight swing low during the Asian session on Thursday. The downtick lacks any fundamental catalyst and is likely to remain limited amid a supportive fundamental backdrop. 

Pi Network flashes bearish potential as selling pressure mounts

Pi Network trades above $0.2000 at press time on Thursday, following a nearly 2% decline the previous day. Centralized Exchanges have received 1.90 million PI tokens over the last 24 hours, suggesting risk-off sentiment among holders. The technical outlook for the PI token remains bearish, with a risk of a cross below the 20-day Exponential Moving Average. 

2026 economic outlook: Clear skies but don’t unfasten your seatbelts yet

Most years fade into the background as soon as a new one starts. Not 2025: a year of epochal shifts, in which the macroeconomy was the dog that did not bark. What to expect in 2026? The shocks of 2025 will not be undone, but neither will they be repeated.

Pi Network Price Forecast: PI flashes bearish potential as selling pressure mounts

Pi Network trades above $0.2000 at press time on Thursday, following a nearly 2% decline the previous day. Centralized Exchanges have received 1.90 million PI tokens over the last 24 hours, suggesting risk-off sentiment among holders.