|

NZD/USD Price Analysis: Pessimistic technical outlook, RSI in oversold area signals might trigger a correction

  • The NZD/USD declined in Wednesday's session, continuing its bearish momentum.
  • RSI has dropped to 34, indicating oversold conditions and rising selling pressure.
  • MACD remains flat and red, suggesting a bearish trend with weakening selling pressure.

In Wednesday's session, the NZD/USD extended its recent decline, falling by 0.27% to 0.6050. The technical indicators remain bearish, indicating a continuation of the selling pressure that has dominated recent trading sessions.

The Relative Strength Index (RSI) has fallen into oversold territory, with a value of 34 and a sharply declining slope. This suggests that selling pressure is increasing and that the bears are gaining strength but that a correction might be in the horizon. The Moving Average Convergence Divergence (MACD) histogram is flat and red, indicating a bearish outlook. As long as the RSI remains below 50 and the MACD remains red, the technical outlook will remain bearish for the NZD/USD but sellers shouldn’t take off the table a healthy correction.

NZD/USD daily chart

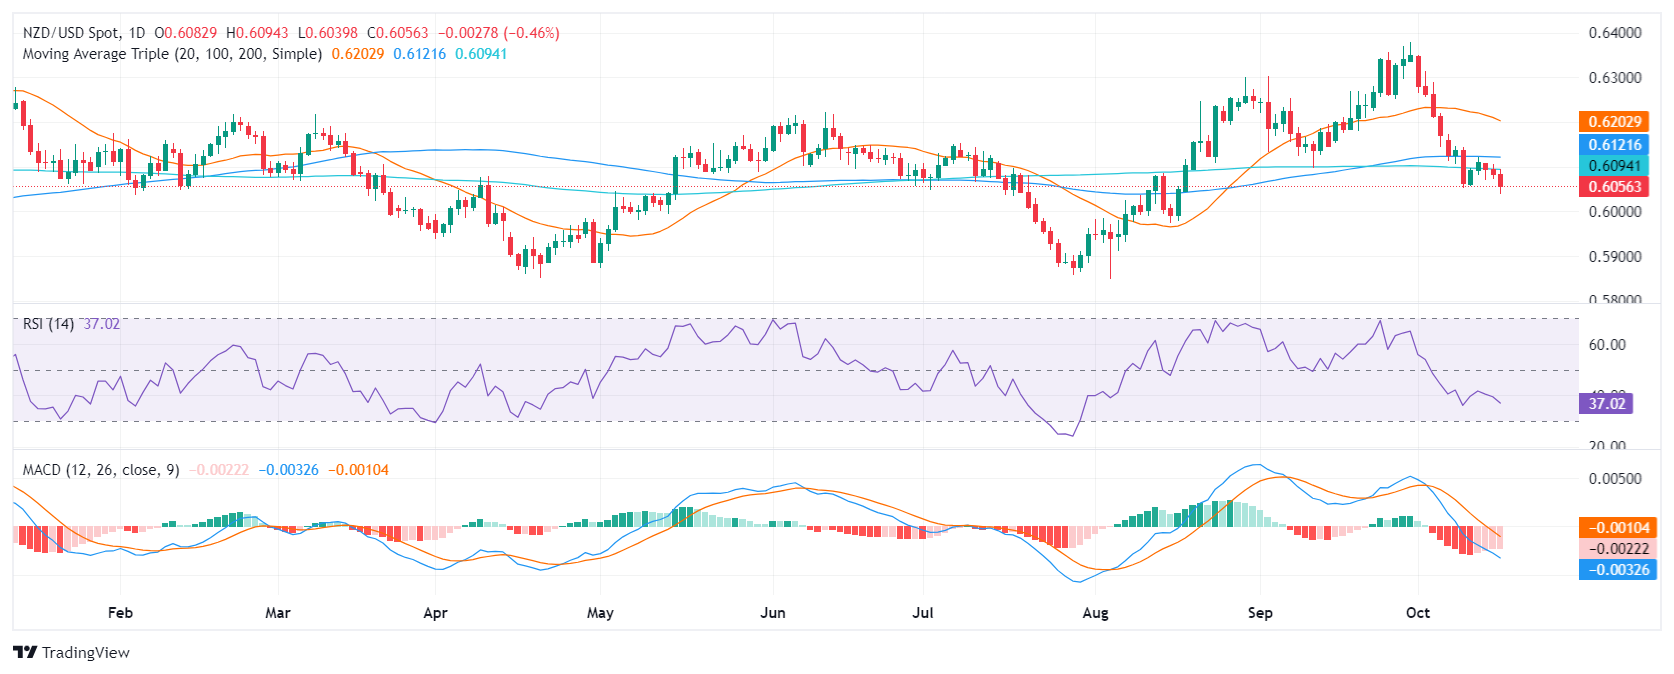
The overall outlook for the NZD/USD remains bearish. The pair has been trading below key support levels for several sessions and has yet to show any signs of a recovery. The 0.6100 area where the 100 and 200-day Simple Moving Average (SMA) remains a key level to watch, as a consolidation below this level could open the door for a further decline towards 0.6000 while an upwards break of this level might trigger a recovery.

Author

Patricio Martín

Patricio is an economist from Argentina passionate about global finance and understanding the daily movements of the markets.

More from Patricio Martín
Share:

Editor's Picks

AUD/USD eyes 0.7150 barrier nine-day EMA

AUD/USD inches higher after registering modest losses in the previous day, trading around 0.7130 during the Asian hours. The technical analysis of the daily chart indicates that the pair is moving sideways within the rectangle pattern, suggesting a consolidation as neither the bulls nor the bears have enough momentum to take control of the market.

USD/JPY trades below 160.00 intervention threshold; bullish bias intact

The USD/JPY pair attracts some sellers during the Asian session amid fears that authorities will step in again to prop up the Japanese Yen. Furthermore, the Israel-Lebanon truce prompts some profit-taking around the US Dollar and exerts downward pressure on the currency pair.

Gold meets contention near $4,420…for now

Gold extends its recovery past the $4,500 mark per troy ounce on Thursday. The yellow metal’s advance comes amid the resurgence of some selling interest around the, improving risk sentiment, and declining US Treasury yields across the curve.

Bitcoin’s massive storm is back: Why the sell-off is far from over

Bitcoin price action over the last few weeks has felt less like a normal, healthy correction and more like a slow grinding crash that continues to wreak havoc on holdings and trading accounts. And everything suggests that the dramatic crash isn’t over.

Nonfarm payrolls: Testing the limits of Fed policy patience

The upcoming nonfarm payrolls report for May will provide the final update on the US labor market before Kevin Warsh attends his first policy meeting as the new Fed Chair later this month.

Recession on paper: What really moves the Canadian Loonie now?

Statistics Canada handed the headline writers a gift and the analysts a headache. Real GDP shrank 0.1% on an annualized basis in the first quarter, and with the fourth quarter of 2025 revised down to a 1.0% contraction, that is two negative quarters in a row, the textbook definition of a technical recession and Canada's first since the pandemic.