|

NZD/USD Price Analysis: Pair weakens as it nears 20-day SMA

  • NZD/USD eases to 0.5655 on Thursday, extending its pullback from recent highs.
  • The pair is approaching the 20-day SMA, a key level that may determine its next move if breached.
  • Technical indicators signal increasing bearish pressure, with RSI declining sharply and MACD showing weakening momentum.

The NZD/USD pair continued its downward drift on Thursday, edging lower to 0.5630 as selling pressure persisted. The pair has been consolidating after failing to maintain its previous upward momentum, and its approach toward the 20-day Simple Moving Average (SMA) could act as a pivotal point for traders. A break below this level may reinforce the bearish outlook, while a bounce could offer short-term support.

Technical indicators suggest growing downside risks. The Relative Strength Index (RSI) has dropped to 46, declining sharply and remaining in negative territory, indicating waning buying interest. Meanwhile, the Moving Average Convergence Divergence (MACD) histogram prints decreasing green bars, suggesting a loss of bullish momentum and a shift in favor of sellers.

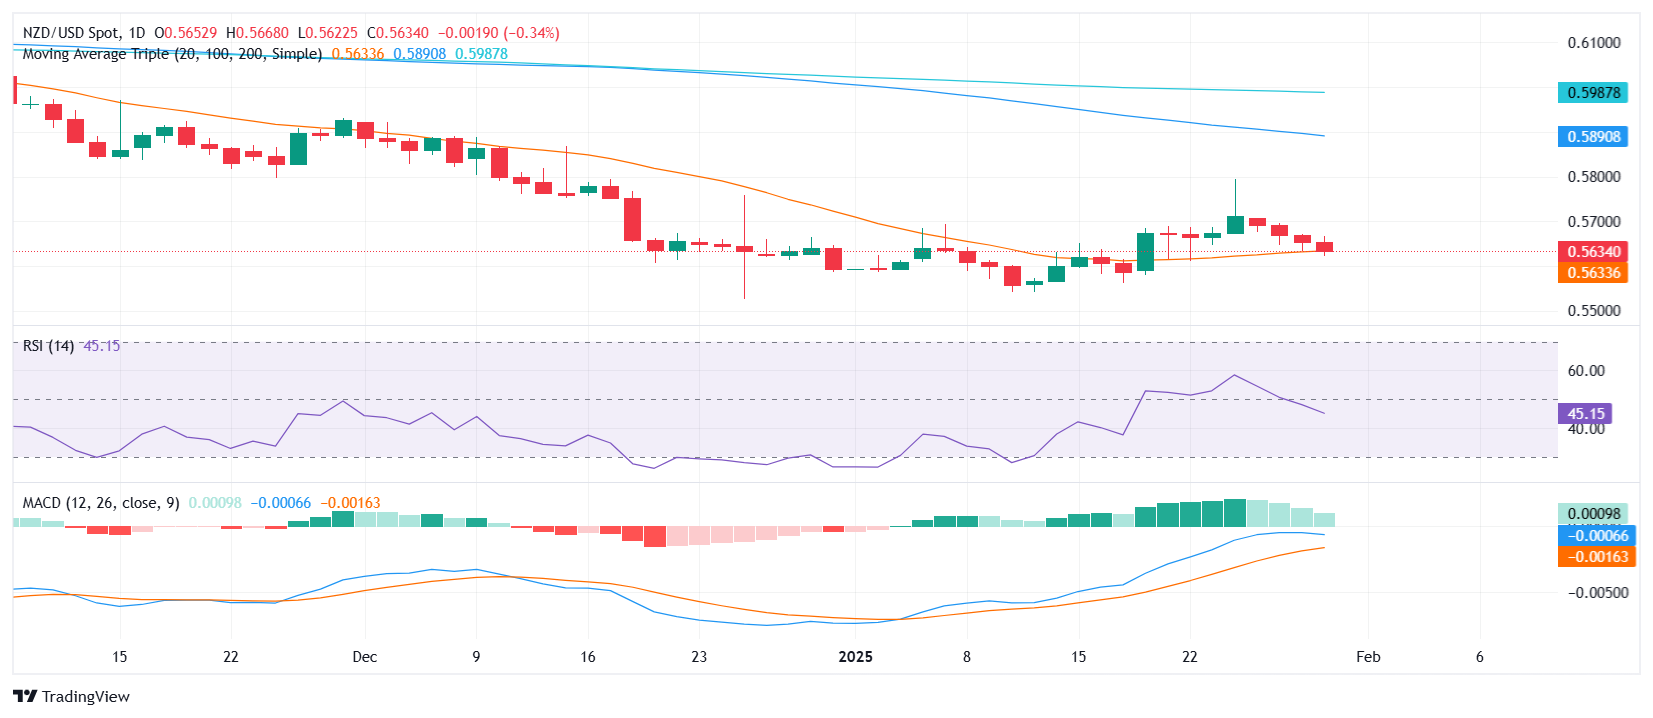
Looking ahead, the 20-day SMA near 0.5630 stands as immediate support. A decisive move below this level could open the door for a decline toward 0.5600, while on the upside, resistance is seen at 0.5685, followed by the psychological barrier at 0.5700. Until the pair clears key resistance levels, downside risks remain dominant.

NZD/USD daily chart

Author

Patricio Martín

Patricio is an economist from Argentina passionate about global finance and understanding the daily movements of the markets.

More from Patricio Martín
Share:

Markets move fast. We move first.

Orange Juice Newsletter brings you expert driven insights - not headlines. Every day on your inbox.

By subscribing you agree to our Terms and conditions.

Editor's Picks

EUR/USD climbs toward 1.1800 on broad USD weakness

EUR/USD gathers bullish momentum and advances toward 1.1800 in the second half of the day on Tuesday. The US Dollar weakens and helps the pair stretch higher after the employment report showed that Nonfarm Payrolls declined by 105,000 in October before rising by 64,000 in November.

GBP/USD climbs to fresh two-month high above 1.3400

GBP/USD gains traction in the American session and trades at its highest level since mid-October above 1.3430. The British Pound benefits from upbeat PMI data, while the US Dollar struggles to find demand following the mixed employment figures and weaker-than-forecast PMI prints, allowing the pair to march north.

Gold extends its consolidative phase around $4,300

Gold trades in positive above $4,300 after spending the first half of the day under bearish pressure. XAU/USD capitalizes on renewed USD weakness after the jobs report showed that the Unemployment Rate climbed to 4.6% in November and the PMI data revealed a loss of growth momentum in the private sector in December. 

US Retail Sales virtually unchanged at $732.6 billion in October

Retail Sales in the United States were virtually unchanged at $732.6 billion in October, the US Census Bureau reported on Tuesday. This print followed the 0.1% increase (revised from 0.3%) recorded in September and came in below the market expectation of +0.1%.

Ukraine-Russia in the spotlight once again

Since the start of the week, gold’s price has moved lower, but has yet to erase the gains made last week. In today’s report we intend to focus on the newest round of peace talks between Russia and Ukraine, whilst noting the release of the US Employment data later on day and end our report with an update in regards to the tensions brewing in Venezuela.

BNB Price Forecast: BNB slips below $855 as bearish on-chain signals and momentum indicators turn negative

BNB, formerly known as Binance Coin, continues to trade down around $855 at the time of writing on Tuesday, after a slight decline the previous day. Bearish sentiment further strengthens as BNB’s on-chain and derivatives data show rising retail activity.