|

NZD/USD Price Analysis: Pair traded neutral, but remains well below 20-day SMA

  • NZD/USD declines on Monday, trades near 0.5960.
  • Pair moved sideways while remaining significantly beneath 20-day SMA.
  • The pair is exhibiting a mixed technical outlook, with the RSI indicating steady selling pressure and the MACD histogram showing declining buying pressure.

The NZD/USD pair traded neutrally on Monday, around 0.5960, and remains well below the 20-day Simple Moving Average (SMA). The pair's technical outlook is mixed, as the Relative Strength Index (RSI) indicates rising selling pressure while the Moving Average Convergence Divergence (MACD) histogram shows declining buying pressure. The overall momentum appears to be neutral, and the pair is likely to remain range-bound in the near term.

The technical indicators provide a mixed outlook for the NZD/USD pair. The RSI, a measure of momentum, is in negative territory and continues to decline, indicating that selling pressure is gradually increasing. The MACD histogram, which measures trend strength and direction, is also decreasing and green, suggesting that buying pressure is declining.

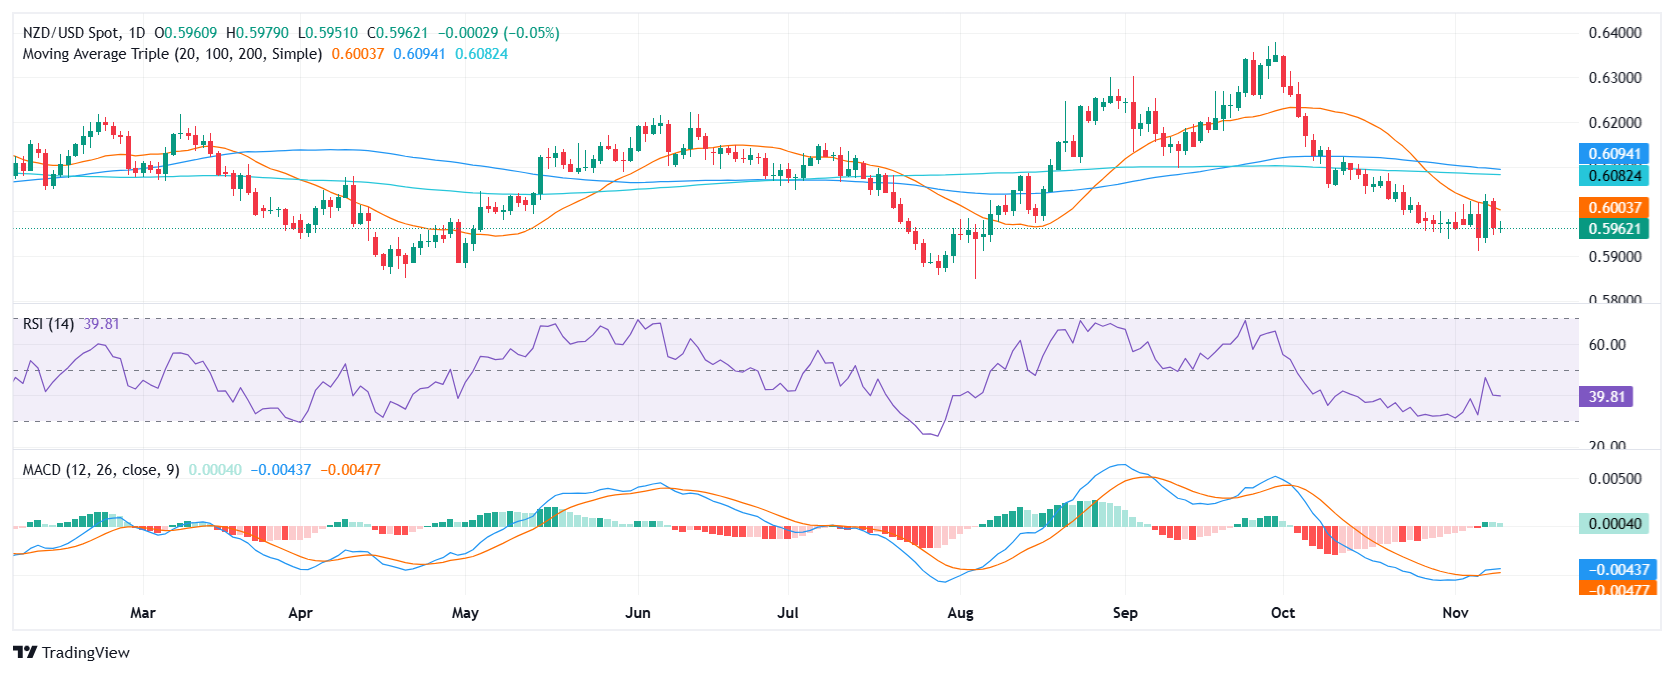
However, the pair trades within a narrow range with no clear direction, keeping the overall outlook neutral in the near term. The multiple rejections last week of the 20-day SMA paints the outlook with red, but the indicators and candles suggests that the pair is set to move sideways in the near term. 

NZD/USD daily chart

Author

Patricio Martín

Patricio is an economist from Argentina passionate about global finance and understanding the daily movements of the markets.

More from Patricio Martín
Share:

Markets move fast. We move first.

Orange Juice Newsletter brings you expert driven insights - not headlines. Every day on your inbox.

By subscribing you agree to our Terms and conditions.

Editor's Picks

EUR/USD clings to small gains near 1.1750

Following a short-lasting correction in the early European session, EUR/USD regains its traction and clings to moderate gains at around 1.1750 on Monday. Nevertheless, the pair's volatility remains low, with investors awaiting this weeks key data releases from the US and the ECB policy announcements.

GBP/USD edges higher toward 1.3400 ahead of US data and BoE

GBP/USD reverses its direction and advances toward 1.3400 following a drop to the 1.3350 area earlier in the day. The US Dollar struggles to gather recovery momentum as markets await Tuesday's Nonfarm Payrolls data, while the Pound Sterling holds steady ahead of the BoE policy announcements later in the week.

Gold stuck around $4,300 as markets turn cautious

Gold loses its bullish momentum and retreats below $4,350 after testing this level earlier on Monday. XAU/USD, however, stays in positive territory as the US Dollar remains on the back foot on growing expectations for a dovish Fed policy outlook next year.

Solana consolidates as spot ETF inflows near $1 billion signal institutional dip-buying

Solana price hovers above $131 at the time of writing on Monday, nearing the upper boundary of a falling wedge pattern, awaiting a decisive breakout. On the institutional side, demand for spot Solana Exchange-Traded Funds remained firm, pushing total assets under management to nearly $1 billion since launch. 

Big week ends with big doubts

The S&P 500 continued to push higher yesterday as the US 2-year yield wavered around the 3.50% mark following a Federal Reserve (Fed) rate cut earlier this week that was ultimately perceived as not that hawkish after all. The cut is especially boosting the non-tech pockets of the market.

Solana Price Forecast: SOL consolidates as spot ETF inflows near $1 billion signal institutional dip-buying

Solana (SOL) price hovers above $131 at the time of writing on Monday, nearing the upper boundary of a falling wedge pattern, awaiting a decisive breakout.