|

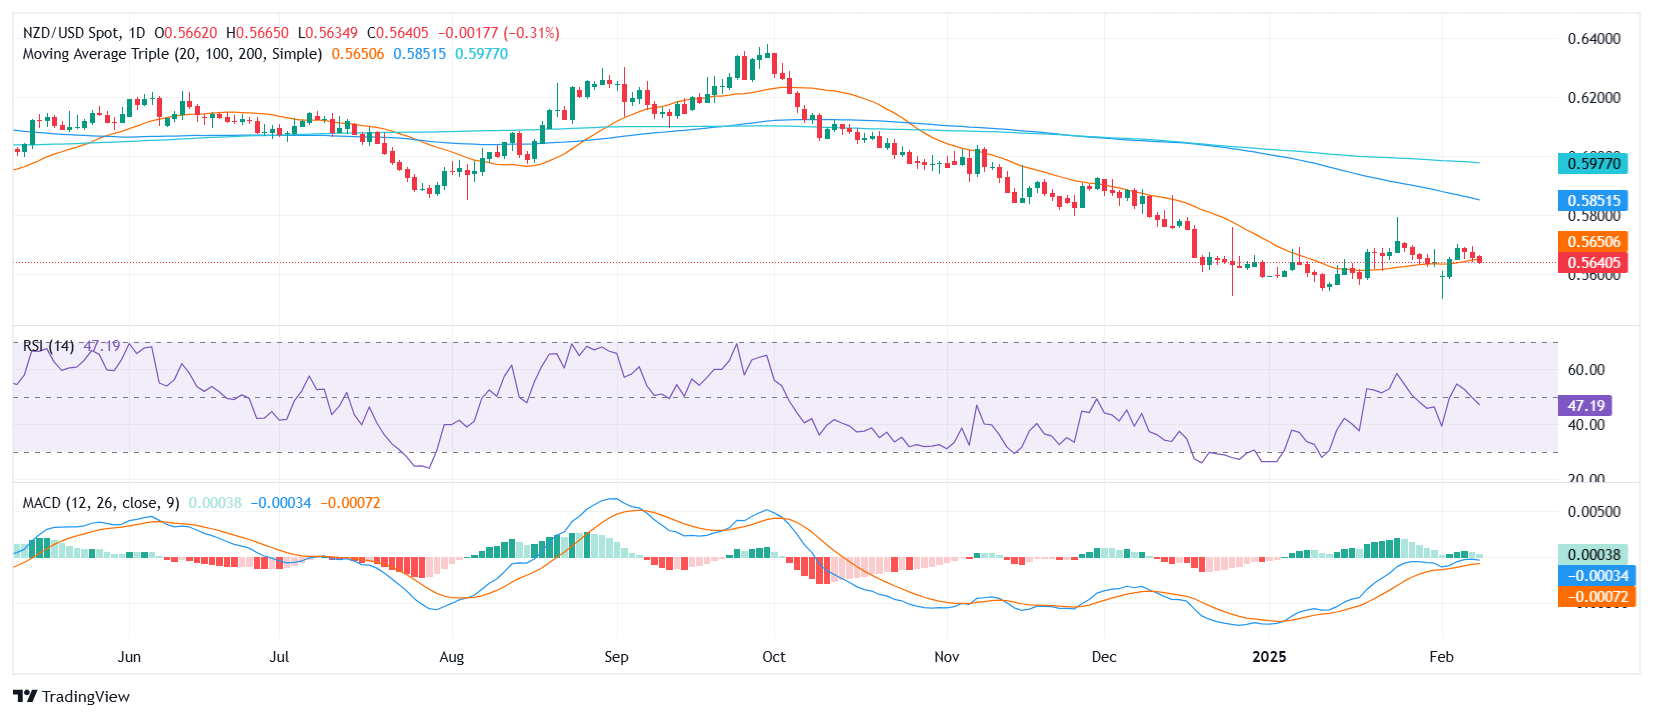
NZD/USD Price Analysis: Pair struggles at 20-day SMA as selling pressure builds

  • NZD/USD dips 0.30% on Monday, trading near 0.5640 amid renewed downside pressure.
  • The pair is testing support at the 20-day SMA, a key threshold for short-term direction.
  • RSI declines in negative territory, while MACD histogram shows weakening bullish momentum.

The NZD/USD pair saw a mild decline on Monday, slipping to 0.5640 as selling pressure persisted. Despite previous attempts to hold above the 20-day Simple Moving Average (SMA), the pair remains vulnerable, with a decisive breakdown of this level likely to accelerate downside risks.

Technical indicators highlight fading bullish momentum. The Relative Strength Index (RSI) has declined sharply to 47, dipping back into negative territory, which suggests a weakening recovery attempt. Meanwhile, the Moving Average Convergence Divergence (MACD) histogram prints decreasing green bars, reinforcing a slowdown in buying interest.

With the 20-day SMA around 0.5650 acting as a pivotal level, a confirmed break below this mark could push NZD/USD toward the next support at 0.5610. On the flip side, a bounce above 0.5675 would help stabilize sentiment and keep buyers engaged in the short term.

NZD/USD daily chart

Author

Patricio Martín

Patricio is an economist from Argentina passionate about global finance and understanding the daily movements of the markets.

More from Patricio Martín
Share:

Editor's Picks

GBP/USD extends slide to fresh 2026-low near 1.3150

GBP/USD resumes its downside in the second half of the day on Wednesday and trades at its lowest level since November 2025 near 1.3150. The pair remains vulnerable amid a broadly firmer US Dollar and chaotic UK political environment. The focus is now on BoE-speak for further trading impetus.

EUR/USD slumps to new yearly low below 1.1350

EUR/USD stays under bearish pressure and trades at its lowest level in a year below 1.1350 on Wednesday. The pair remains vulnerable to further declines amid a bullish US Dollar, which continues to draw support from hawkish Fed bets and US-Iran peace deal uncertainty.

Gold closes in on $4,000 on persistent USD strength

Gold remains under persistent selling pressure and trades at its lowest level since November near $4,000 on Wednesday, losing more than 2.5% on the day. Hawkish Fed pricing, broad-based US Dollar strength and the uncertainty surrounding the US-Iran peace agreement make it difficult for the precious metal to find a foothold.

Crypto Today: Bitcoin, Ethereum, XRP trade under pressure as September Fed rate-hike odds increase

Bitcoin is trading between $62,000 and $63,000 at the time of writing on Wednesday, weighed down by headwinds stemming from macroeconomic uncertainty and geopolitical tensions in the Middle East.

5.90% to 5.45%: Why the Pound ignored the bond market’s relief rally

Keir Starmer resigned on Monday, and the Pound barely moved. That near-silence is the tell. Sterling's real driver these past four months has not been the prime minister, nor the left-leaning frontrunner lining up to replace him, but the long end of the gilt curve, which answers to a force no British politician controls.

Regime change: Inside Kevin Warsh's first move to make the Fed unreadable on purpose

The rate did not move. That was the least interesting thing about Kevin Warsh's first meeting in charge of the Fed. The FOMC held its benchmark at 3.50%-3.75% for the fourth straight meeting, exactly as priced, and then the new chair used his first press conference to dismantle the machinery the market has leaned on for a decade.