|

NZD/USD Price Analysis: Needs acceptance above 0.6200 for further rally

  • NZD/USD has shown a recovery move to near 0.6200 despite the NZ economy reporting a technical recession.
  • Fed Powell confirmed that rate cuts are not appropriate this year.
  • NZD/USD faced sheer resistance near the 61.8% Fibonacci retracement at 0.6230.

The NZD/USD pair has rebounded after sensing buying interest near 0.6160 in the early London session. The Kiwi asset is struggling to find acceptance above the round-level resistance of 0.6200 despite multiple attempts.

S&P500 futures have generated more losses as the market sentiment is turning cautious. A skip in the interest rate regime by the Federal Reserve (Fed) lacks optimism as the policy-tightening spell is not concluded now. Also, Fed chair Jerome Powell confirmed that rate cuts are not appropriate this year.

Meanwhile, the New Zealand economy has reported a technical recession as quarterly Gross Domestic Product (GDP) has contracted by 0.1% as expected. Also, the Kiwi economy reported a contraction in its former GDP figures by 0.7%. Two consecutive time contraction in quarterly GDP figures of an economy is considered a technical recession.

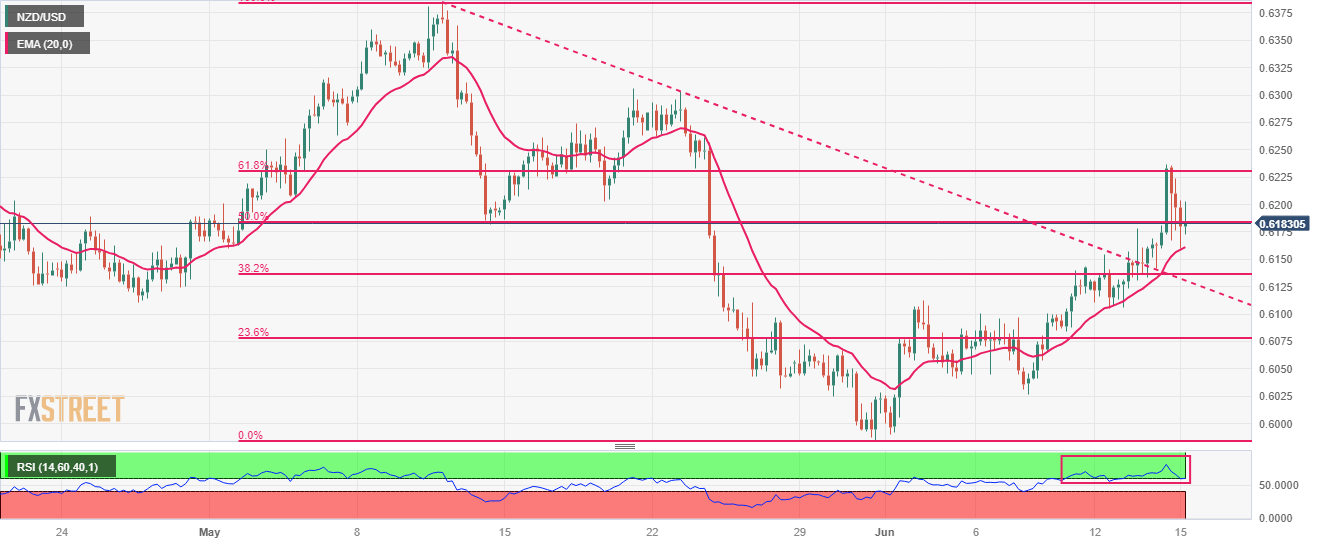
NZD/USD faced sheer resistance near the 61.8% Fibonacci retracement (plotted from May 11 high at 0.6385 to May 31 low at 0.5985) at 0.6230 on a four-hour scale. The downward-sloping trendline placed from May 11 high at 0.6385 will continue to provide support to the New Zealand Dollar bulls. Also, the 20-period Exponential Moving Average (EMA) at 0.6161 is acting as a cushion for the Kiwi bulls.

The Relative Strength Index (RSI) (14) is making efforts in keeping its auction in the bullish range of 60.0-80.00.

A confident break above the round-level resistance at 0.6200 will drive the Kiwi asset toward May 17 high at 0.6261 followed by May 19 high at 0.6306.

Alternatively, a downside move below the intraday low at 0.6015 will expose the asset for a fresh six-month low toward 11 November 2022 low at 0.5984. A slippage below the latter would expose the asset toward 02 November 2022 high at 0.5941.

NZD/USD four-hour chart
NZD/USD

Overview
Today last price0.6178
Today Daily Change-0.0028
Today Daily Change %-0.45
Today daily open0.6206
 
Trends
Daily SMA200.6113
Daily SMA500.6179
Daily SMA1000.6224
Daily SMA2000.615
 
Levels
Previous Daily High0.6236
Previous Daily Low0.6133
Previous Weekly High0.6143
Previous Weekly Low0.6026
Previous Monthly High0.6385
Previous Monthly Low0.5985
Daily Fibonacci 38.2%0.6197
Daily Fibonacci 61.8%0.6173
Daily Pivot Point S10.6147
Daily Pivot Point S20.6089
Daily Pivot Point S30.6044
Daily Pivot Point R10.6251
Daily Pivot Point R20.6295
Daily Pivot Point R30.6354

Author

Sagar Dua

Sagar Dua

FXStreet

Sagar Dua is associated with the financial markets from his college days. Along with pursuing post-graduation in Commerce in 2014, he started his markets training with chart analysis.


More from Sagar Dua
Share:

Editor's Picks

GBP/USD gains ground as US Dollar struggles ahead of Fed decision

GBP/USD edges higher after remaining flat in the previous day, trading around 1.3300 during the Asian hours on Wednesday. The currency pair gains ground as the US Dollar struggles ahead of the Federal Reserve’s upcoming policy decision.


EUR/USD advances as US Dollar declines ahead of Fed policy decision

EUR/USD holds ground for the second successive day, trading around 1.1390 during the Asian hours on Wednesday. The US Dollar struggles against the Euro as investors are closely monitoring the Federal Reserve’s upcoming policy decision, where the central bank is widely expected to leave interest rates unchanged.

Gold looks to the Fed for the next big move

Gold is attempting a tepid bounce from six-day lows near $4,000 in Wednesday’s Asian trades, awaiting the US Federal Reserve monetary policy outcome to determine the next major move.

Bitcoin slips below support, Ethereum and XRP flash bearish signals

Bitcoin, Ethereum and Ripple remain under pressure on Wednesday after a mild correction earlier this week. BTC slips below a key support zone, and ETH is testing a key resistance zone. Meanwhile, XRP is drifting toward the psychologically important $1.00 support level.

WTI rebounds from two-week low, well bid around mid-$81.00s amid Iran risks

West Texas Intermediate – the benchmark US Crude Oil price – gains strong positive traction during the Asian session on Wednesday, snapping a three-day losing streak to an over two-week low touched the previous day. The commodity currently trades around mid-$81.00s, up nearly 4% for the day, amid the risk of resumption of US-Iran hostilities.

US Dollar mid-year outlook: Exceptional currency, exceptional risks?
The US Dollar enters the second half of 2026 in a markedly different position from a year ago. The King currency has recovered, reflecting persistent US inflation, changing expectations for Fed policy, geopolitical tensions and renewed demand for defensive assets.















