|

NZD/USD Price Analysis: Momentum slackens as buyers get rejected at the 200-day SMA

  • The daily chart reveals a subtle change in buyers' momentum, noted by decreasing MACD green bars and a neutral RSI.
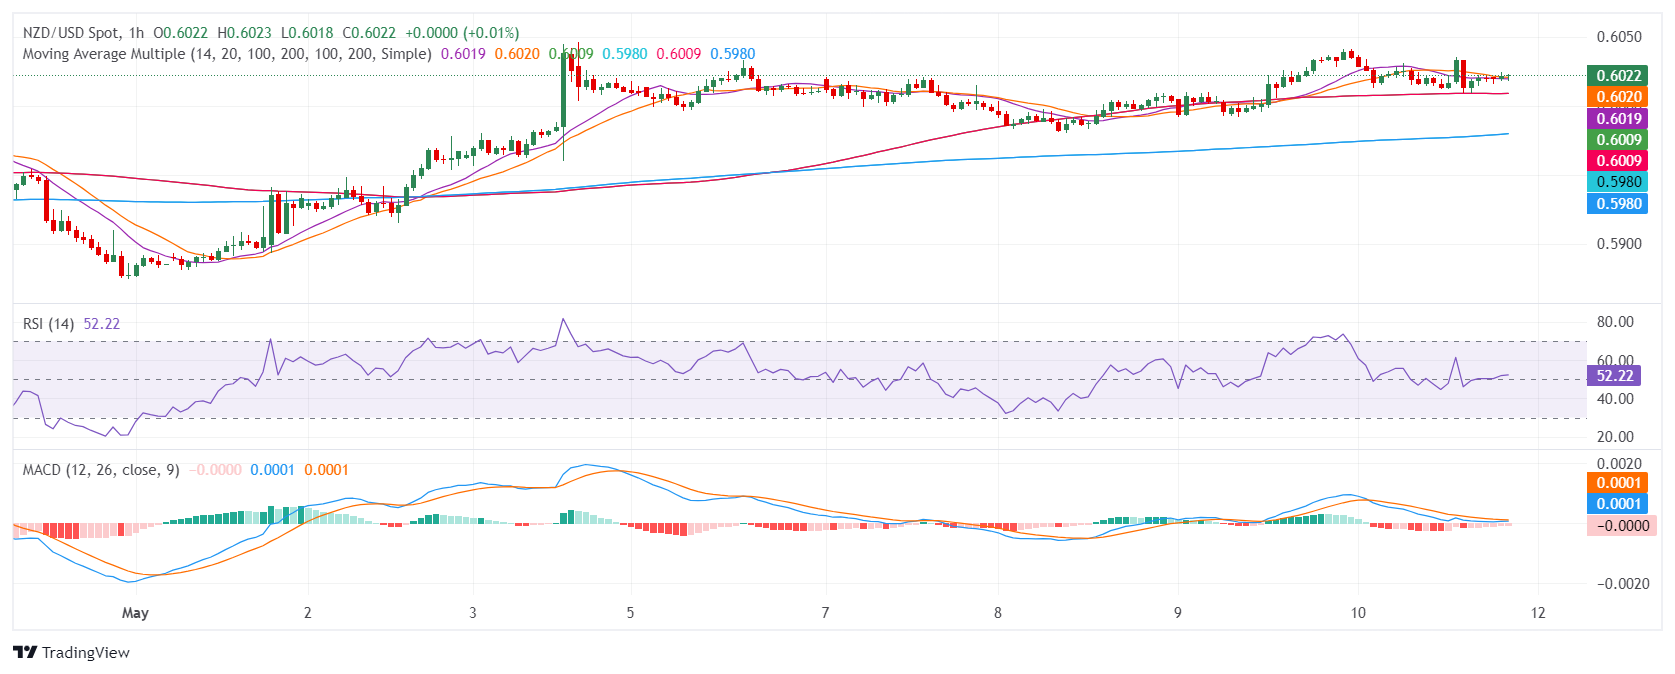
  • Hourly indicators picture a balanced scenario for the session.

At the end of the week, the NZD/USD has lost 0.21% as buyers seem to have run out of steam. The sluggish trend momentum might suggest an emerging bearish grip, although the short-term positive outlook remains largely unbroken.

Despite the Relative Strength Index (RSI) sitting in the neutral zone and displaying a positive outlook, the overall trend appears to be flattening. The Moving Average Convergence Divergence (MACD) also echoes the slowing momentum, printing decreasing green bars.

NZD/USD daily chart

The hourly view shows a neutral bias with a mild lack of traction for either party reflected by the flat RSI and MACD.

NZD/USD hourly chart

A broader inspection highlights the NZD/USD residing beneath the crucial 100 and 200-day Simple Moving Averages (SMAs), lending credence to a bearish outlook. The alleged sellers' strength is verified at the 200-day SMA barrier, further solidifying the short-term bearish slant as it rejected the buyers in Friday’s session. However, if the bulls manage to hold the key short-term 20-day SMA, the downside in the next sessions will be limited.

NZD/USD

Overview
Today last price0.6022
Today Daily Change-0.0013
Today Daily Change %-0.22
Today daily open0.6035
 
Trends
Daily SMA200.5948
Daily SMA500.6013
Daily SMA1000.6092
Daily SMA2000.6039
 
Levels
Previous Daily High0.6037
Previous Daily Low0.5992
Previous Weekly High0.6046
Previous Weekly Low0.5875
Previous Monthly High0.6079
Previous Monthly Low0.5851
Daily Fibonacci 38.2%0.602
Daily Fibonacci 61.8%0.6009
Daily Pivot Point S10.6006
Daily Pivot Point S20.5976
Daily Pivot Point S30.5961
Daily Pivot Point R10.6051
Daily Pivot Point R20.6066
Daily Pivot Point R30.6096

Author

Patricio Martín

Patricio is an economist from Argentina passionate about global finance and understanding the daily movements of the markets.

More from Patricio Martín
Share:

Markets move fast. We move first.

Orange Juice Newsletter brings you expert driven insights - not headlines. Every day on your inbox.

By subscribing you agree to our Terms and conditions.

Editor's Picks

EUR/USD drops to daily lows near 1.1630

EUR/USD now loses some traction and slips back to the area of daily lows around 1.1630 on the back of a mild bounce in the US Dollar. Fresh US data, including the September PCE inflation numbers and the latest read on December consumer sentiment, didn’t really move the needle, so the pair is still on course to finish the week with a respectable gain.

GBP/USD trims gains, recedes toward 1.3320

GBP/USD is struggling to keep its daily advance, coming under fresh pressure and retreating to the 1.3320 zone following a mild bullish attempt in the Greenback. Even though US consumer sentiment surprised to the upside, the US Dollar isn’t getting much love, as traders are far more interested in what the Fed will say next week.

Gold makes a U-turn, back to $4,200

Gold is now losing the grip and receding to the key $4,200 region per troy ounce following some signs of life in the Greenback and a marked bounce in US Treasury yields across the board. The positive outlook for the precious metal, however, remains underpinned by steady bets for extra easing by the Fed.

Crypto Today: Bitcoin, Ethereum, XRP pare gains despite increasing hopes of upcoming Fed rate cut

Bitcoin is steadying above $91,000 at the time of writing on Friday. Ethereum remains above $3,100, reflecting positive sentiment ahead of the Federal Reserve's (Fed) monetary policy meeting on December 10.

Week ahead – Rate cut or market shock? The Fed decides

Fed rate cut widely expected; dot plot and overall meeting rhetoric also matter. Risk appetite is supported by Fed rate cut expectations; cryptos show signs of life. RBA, BoC and SNB also meet; chances of surprises are relatively low.

Ripple faces persistent bear risks, shrugging off ETF inflows

Ripple is extending its decline for the second consecutive day, trading at $2.06 at the time of writing on Friday. Sentiment surrounding the cross-border remittance token continues to lag despite steady inflows into XRP spot ETFs.