|

NZD/USD Price Analysis: Kiwi trades sideways, outlook hinges on SMA convergence

  • NZD/USD moved sideways with mild losses while pair remains under the 20-day SMA.
  • The Kiwi's outlook continues to skew bearish in the short term while the 100 and 200-day SMAs converge at 0.6070 potentially brightening the broader picture.
  • Despite the bearish sentiment, a break above 0.6150, the position of the 20-day SMA, would change direction.

On Tuesday, the NZD/USD continues to trade sideways with minor losses. Sellers have consolidated their stance and taken the pair under the 20-day Simple Moving Average (SMA). Despite this, the convergence of the 100 and 200-day SMAs at 0.6070 could paint a more optimistic picture if they complete a bullish crossover.

The Relative Strength Index (RSI) on the daily chart fell to 49, suggesting more bearishness. Still, despite the downward shift, the RSI remains near the neutral zone. The Moving Average Convergence Divergence (MACD) remains flat with red bars, showcasing a seller's market.

NZD/USD daily chart

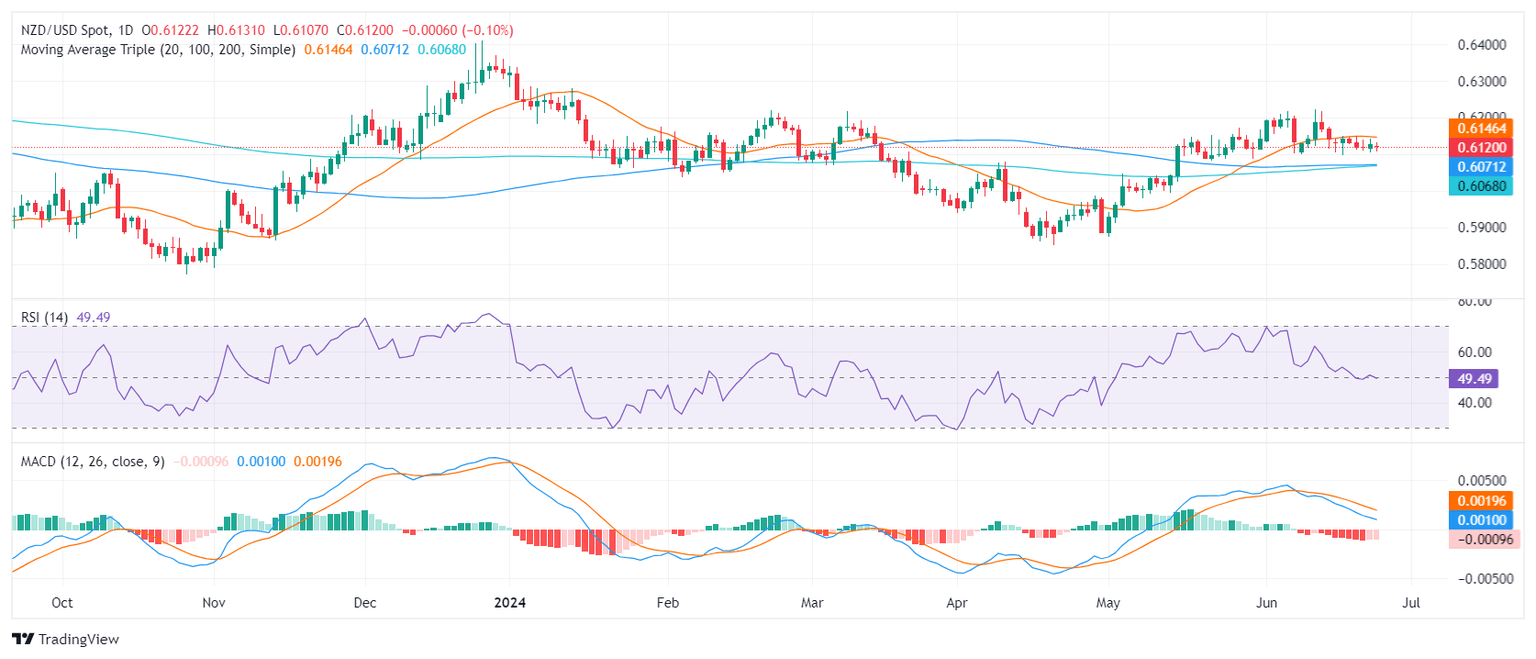
The NZD/USD finds immediate support near the 0.6100 level. Beneath that, additional support is available at the converging 100 and 200-day SMAs at 0.6070. If the pair continues its descent, these levels could provide a robust defense. A failure to hold these SMAs could signal a deepening of the sell-off scenario.

Conversely, resistance remains at the 20-day SMA at 0.6150, with additional resistance points at 0.6170 and 0.6200. A decisive breakout above these levels might indicate an end to the current bearish market sentiment and a shift in favor of the bulls.

NZD/USD

Overview
Today last price0.612
Today Daily Change-0.0006
Today Daily Change %-0.10
Today daily open0.6126
 
Trends
Daily SMA200.6147
Daily SMA500.6063
Daily SMA1000.6071
Daily SMA2000.6067
 
Levels
Previous Daily High0.6141
Previous Daily Low0.6104
Previous Weekly High0.6149
Previous Weekly Low0.6096
Previous Monthly High0.6171
Previous Monthly Low0.5875
Daily Fibonacci 38.2%0.6127
Daily Fibonacci 61.8%0.6118
Daily Pivot Point S10.6106
Daily Pivot Point S20.6087
Daily Pivot Point S30.6069
Daily Pivot Point R10.6143
Daily Pivot Point R20.6161
Daily Pivot Point R30.618

Author

Patricio Martín

Patricio is an economist from Argentina passionate about global finance and understanding the daily movements of the markets.

More from Patricio Martín
Share:

Markets move fast. We move first.

Orange Juice Newsletter brings you expert driven insights - not headlines. Every day on your inbox.

By subscribing you agree to our Terms and conditions.

Editor's Picks

EUR/USD struggles for direction amid USD gains

EUR/USD is trimming part of its earlier gains, coming under some mild downside pressure near 1.1730 as the US Dollar edges higher. Markets are still digesting the Fed’s latest rate decision, while also looking ahead to more commentary from Fed officials in the sessions ahead.

GBP/USD drops to daily lows near 1.3360

Disappointing UK data weighed on the Sterling towards the end of the week, triggering a pullback in GBP/USD to fresh daily lows near 1.3360. Looking ahead, the next key event across the Channel is the BoE meeting on December 18.

Gold losses momentum, challenges $4,300

Gold now gives away some gains and disputes the key $4,300 zone per troy ounce following earlier multi-week highs. The move is being driven by expectations that the Fed will deliver further rate cuts next year, with the yellow metal climbing despite a firmer Greenback and rising US Treasury yields across the board.

Litecoin Price Forecast: LTC struggles to extend gains, bullish bets at risk

Litecoin (LTC) price steadies above $80 at press time on Friday, following a reversal from the $87 resistance level on Wednesday. Derivatives data suggests a bullish positional buildup while the LTC futures Open Interest declines, flashing a long squeeze risk.

Big week ends with big doubts

The S&P 500 continued to push higher yesterday as the US 2-year yield wavered around the 3.50% mark following a Federal Reserve (Fed) rate cut earlier this week that was ultimately perceived as not that hawkish after all. The cut is especially boosting the non-tech pockets of the market.

Aave Price Forecast: AAVE primed for breakout as bullish signals strengthen

Aave (AAVE) price is trading above $204 at the time of writing on Friday and approaching the upper boundary of its descending parallel channel; a breakout from this structure would favor the bulls.