|

NZD/USD Price Analysis: Kiwi trades near key SMAs as upside momentum stalls

  • NZD/USD was seen hovering around the 0.5725 zone with mild losses ahead of the Asian session.
  • The pair remains trapped near the convergence of the 20- and 100-day SMAs, limiting directional momentum.
  • Support rests at the 0.5700 threshold, while the RSI hovers near the middlepoint, pointing to a lack of strong conviction.

The NZD/USD pair was seen trading near the 0.5725 area on Monday, showing mild downside pressure ahead of the Asian session. After a short-lived attempt to gather bullish traction, the kiwi remains capped by the convergence of two key daily moving averages, which continue to act as a magnet for price action. Indicators now show signs of weakening momentum, hinting at limited follow-through in either direction for now.

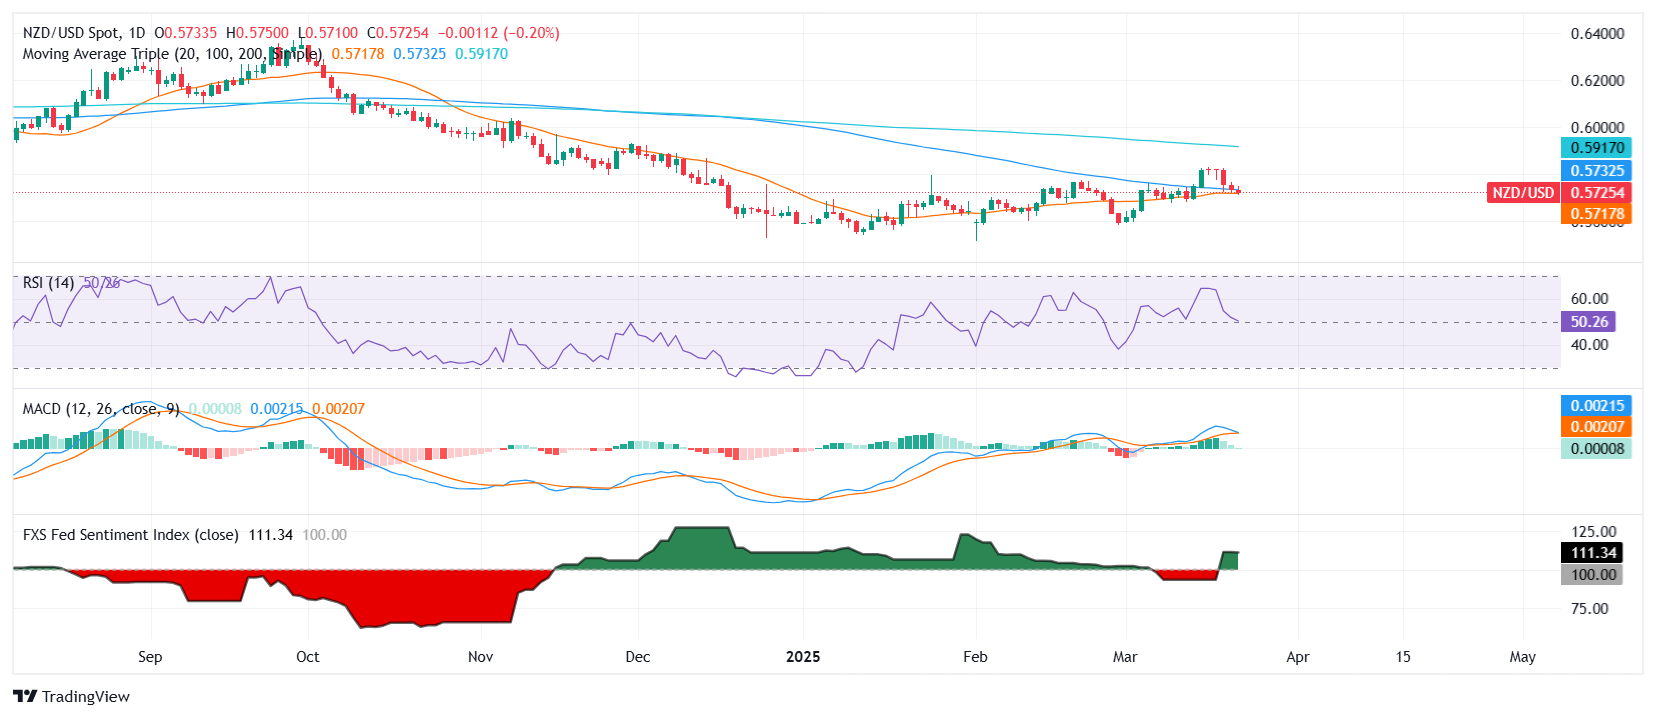
On the technical front, the Relative Strength Index (RSI) sits right around the 50 mark and is mildly declining, reflecting a neutral momentum profile and lack of strong directional bias. Meanwhile, the Moving Average Convergence Divergence (MACD) is printing decreasing green bars, suggesting that bullish momentum is gradually fading. These developments reinforce the idea that the pair might remain rangebound unless a breakout occurs.

The 20-day and 100-day Simple Moving Averages, clustered around 0.5730, have become pivotal levels. A decisive break below this area could expose the next support near 0.5700, opening the door for further downside in the near term. Conversely, holding above these SMAs could allow buyers to retest the 0.5780 region and potentially eye the 0.5830 zone beyond.

NZD/USD daily chart

Author

Patricio Martín

Patricio is an economist from Argentina passionate about global finance and understanding the daily movements of the markets.

More from Patricio Martín
Share:

Markets move fast. We move first.

Orange Juice Newsletter brings you expert driven insights - not headlines. Every day on your inbox.

By subscribing you agree to our Terms and conditions.

Editor's Picks

EUR/USD holds steady near 1.1750 on first trading day of 2026

EUR/USD stays calm on Friday and trades in a narrow channel at around 1.1750 as trading conditions remain thin following the New Year holiday and ahead of the weekend. The economic calendar will not feature any high-impact data releases.

GBP/USD struggles to gain traction, stabilizes above 1.3450

After testing 1.3400 on the last day of 2025, GBP/USD managed to stage a rebound. Nevertheless, the pair finds it difficult to gather momentum and moves sideways above 1.3450 as market participants remain in holiday mood.

Gold climbs toward $4,400 following deep correction

Gold reverses its direction and advances toward $4,400 after suffering heavy losses amid profit-taking before the New Year holiday. Growing expectations for a dovish Fed policy and persistent geopolitical risks seem to be helping XAU/USD stretch higher.

Cardano gains early New Year momentum, bulls target falling wedge breakout

Cardano kicks off the New Year on a positive note and is extending gains, trading above $0.36 at the time of writing on Friday. Improving on-chain and derivatives data point to growing bullish interest, while the technical outlook keeps an upside breakout in focus.

Economic outlook 2026-2027 in advanced countries: Solidity test

After a year marked by global economic resilience and ending on a note of optimism, 2026 looks promising and could be a year of solid economic performance. In our baseline scenario, we expect most of the supportive factors at work in 2025 to continue to play a role in 2026.

Crypto market outlook for 2026

Year 2025 was volatile, as crypto often is.  Among positive catalysts were favourable regulatory changes in the U.S., rise of Digital Asset Treasuries (DAT), adoption of AI and tokenization of Real-World-Assets (RWA).