|

NZD/USD Price Analysis: Kiwi rebound needs acceptance from 0.6220 and NZ/US employment

  • NZD/USD takes the bids to refresh intraday high, prints the first daily gain in four.
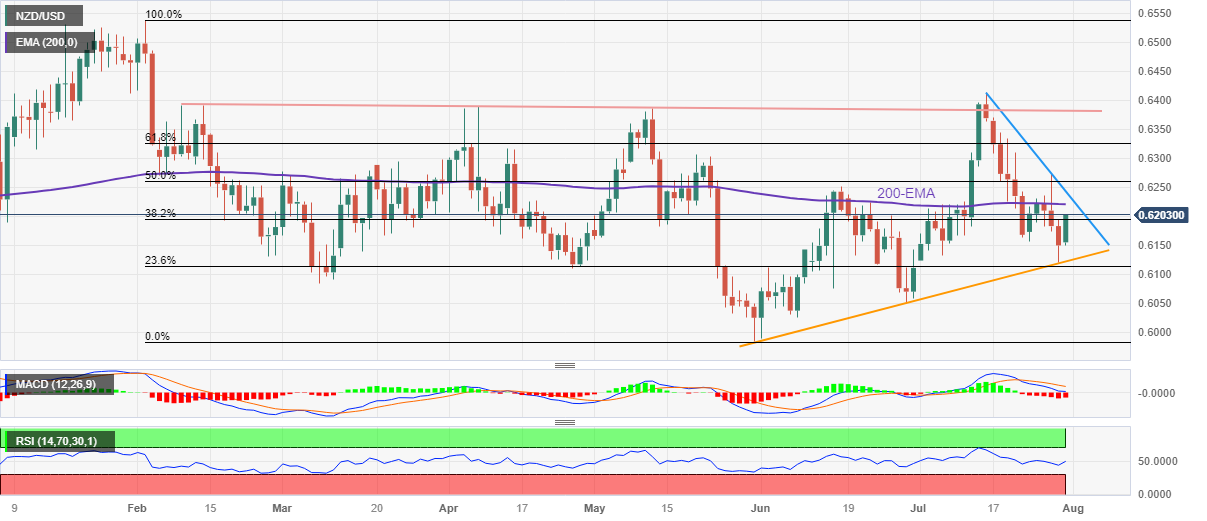
  • Kiwi pair’s recovery from two-month-old support line needs validation from 200-EMA and NZ/US data.
  • Downbeat oscillators, two-week-old falling resistance line acts as additional upside filters.

NZD/USD snaps a three-day downtrend as it extends late Friday’s rebound from a two-month-old ascending support line towards 0.6200 heading into Monday’s European session. In doing so, the Kiwi pair cheers upbeat sentiment data at home, as well as China stimulus, while teasing the bulls as markets await July’s employment data for New Zealand (NZ) and the US.

However, the bearish MACD signals join the near 50.0 levels of the RSI (14) line and the 200-Exponential Moving Average (EMA) surrounding 0.6220 to challenge the NZD/USD bulls.

Even if the quote crosses the 0.6220 hurdle, a downward-sloping resistance line from July 14, close to 0.6240 at the latest, can act as the final defense of the NZD/USD buyers, a break of which could quickly propel the quote past the 0.6300 round figure. The same highlights an upward-sloping resistance line from early February, near 0.6380 by the press time.

On the flip side, a daily closing below the three-month-old rising support line, surrounding 0.6130 at the latest, could drag the price toward the lows marked in June and March, near 0.6050 and 0.6085.

Should the NZD/USD remains bearish past 0.6050, multiple levels around 0.6030 and the 0.6000 round figure will be crucial for the bears to watch.

Overall, the Kiwi pair buyers flex their muscles but the bears are still in the driver’s seat.

NZD/USD: Daily chart

Trend: Limited recovery expected

Additional important levels

Overview
Today last price0.6196
Today Daily Change0.0046
Today Daily Change %0.75%
Today daily open0.615
 
Trends
Daily SMA200.6229
Daily SMA500.6168
Daily SMA1000.6198
Daily SMA2000.6219
 
Levels
Previous Daily High0.6195
Previous Daily Low0.612
Previous Weekly High0.6274
Previous Weekly Low0.612
Previous Monthly High0.625
Previous Monthly Low0.599
Daily Fibonacci 38.2%0.6149
Daily Fibonacci 61.8%0.6166
Daily Pivot Point S10.6115
Daily Pivot Point S20.608
Daily Pivot Point S30.604
Daily Pivot Point R10.619
Daily Pivot Point R20.623
Daily Pivot Point R30.6265

Author

Anil Panchal

Anil Panchal

FXStreet

Anil Panchal has nearly 15 years of experience in tracking financial markets. With a keen interest in macroeconomics, Anil aptly tracks global news/updates and stays well-informed about the global financial moves and their implications.

More from Anil Panchal
Share:

Editor's Picks

EUR/USD faces some resistance near 100-SMA on H4, around 1.1830 zone

The EUR/USD pair gains some follow-through positive traction for the second consecutive day and climbs to the 1.1830 region during the Asian session on Thursday. The US Dollar remains on the back foot amid concerns about the economic fallout from US President Donald Trump's erratic trade policies and acts as a tailwind for spot prices.

GBP/USD extends recovery to near 20-day EMA as US Dollar weakens

The Pound Sterling holds onto weekly gains around 1.3565 against the US Dollar during the Asian trading session on Thursday. The GBP/USD pair trades firmly as the US Dollar remains under pressure due to uncertainty surrounding the United States trade policy outlook.

Gold looks to build on strength beyond $5,200, eyes monthly peak amid safe-haven flows

Gold touches a fresh daily high heading into the European session on Thursday, with bulls looking to build on the momentum beyond the $5,200 mark. This marks the second straight day of a positive move and is supported by sustained safe-haven flows, bolstered by uncertainties surrounding US President Donald Trump's trade policies and US-Iran nuclear talks.

Stellar: Relief bounce fades as bearish undertone persists

Stellar is trading around $0.16 at the time of writing on Thursday after rebounding more than 8% in the previous day. Derivatives data paints a negative picture as XLM’s short bets hit a monthly high while Open Interest continues to decline.

Nvidia delivers another monster earnings report, and forecasts big things to come

It was another monster earnings report from Nvidia for fiscal Q4. Revenues were $68.1bn, smashing estimates of $65bn. Gross profit margin was a healthy 75%, up from 73.5% in the prior quarter, and the outlook for this quarter was monstrous.

Solana strikes key resistance with double-digit gains

Solana trades at $88 at press time on Thursday, after an 11% upswing the previous day within a broader consolidation range of roughly three weeks. Institutional demand for Solana heightens as US spot SOL Exchange Traded Funds record $30 million of inflow on Wednesday.