|

NZD/USD Price Analysis: Kiwi plunges below 0.5600 as sellers extend their grip

  • NZD/USD fell sharply toward the 0.5600 zone on Friday, tracking heavy daily losses ahead of the Asian session.
  • Momentum indicators align bearishly, with MACD and Bull Bear Power showing clear selling pressure.
  • Major moving averages and resistance near 0.5700 cap upside attempts for now.

The NZD/USD pair collapsed on Friday, diving toward the 0.5600 area as bearish momentum dominated the session. The pair traded deep in the red, shedding over 3% on the day and remaining mid-range between recent extremes at 0.5551 and 0.5798. Sellers stayed firmly in control through the day, with technical indicators confirming the downturn. The action unfolds during Friday’s session ahead of the Asian opening.

Daily chart

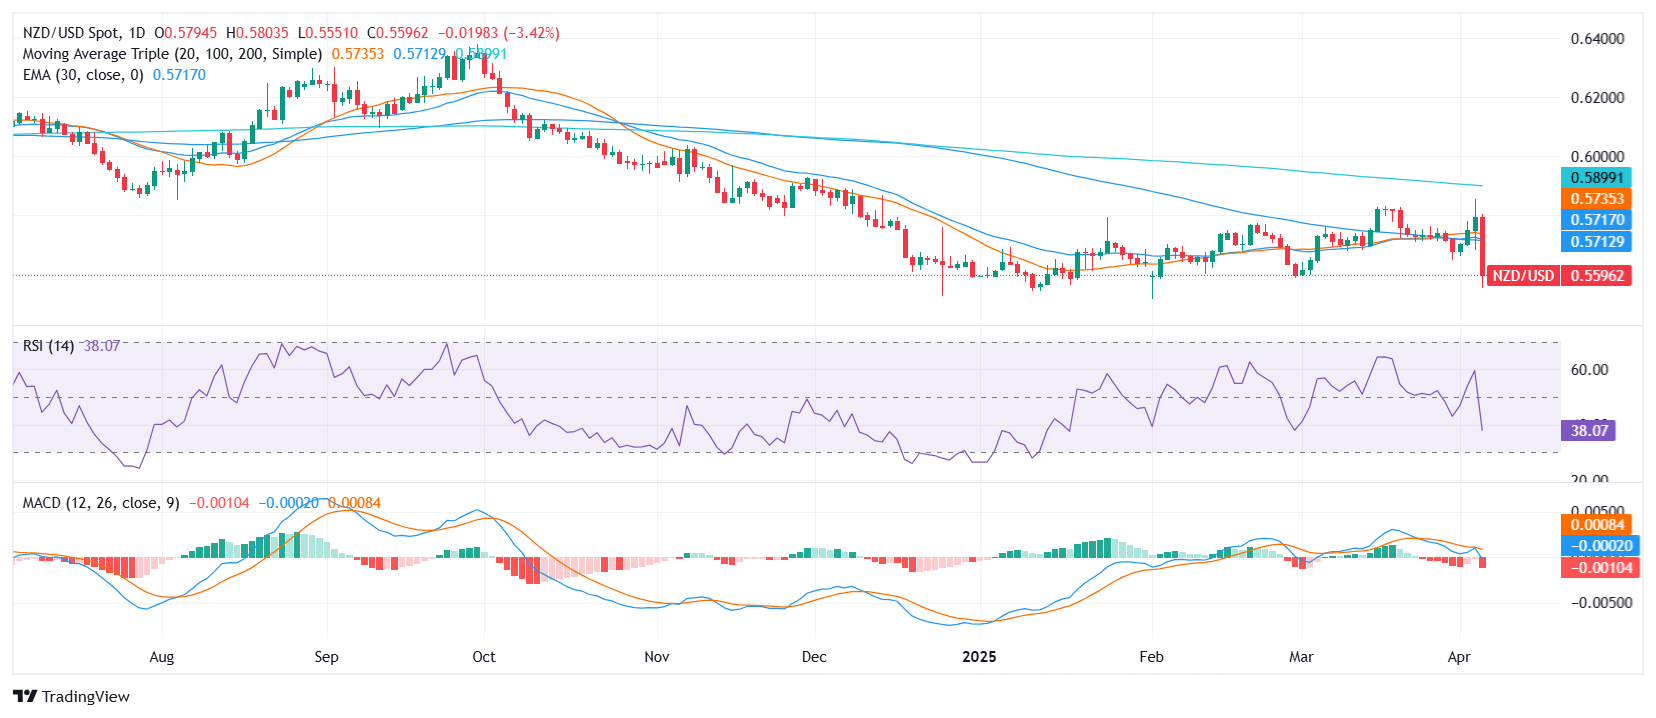
Technicals suggest a clear downside bias. The Moving Average Convergence Divergence (MACD) and Bull Bear Power indicator both print sell signals, amplifying bearish sentiment. While the Relative Strength Index (RSI) at 37.21 flirts with oversold territory.

Moving averages reinforce the bearish tone across the board. The 10-day Exponential Moving Average (EMA) at 0.57105 and 10-day Simple Moving Average (SMA) at 0.57148 are both aligned lower. Longer-term indicators, including the 20-day SMA at 0.57342, the 100-day at 0.57177, and the 200-day at 0.59039, confirm an extended period of selling pressure.

Author

Patricio Martín

Patricio is an economist from Argentina passionate about global finance and understanding the daily movements of the markets.

More from Patricio Martín
Share:

Markets move fast. We move first.

Orange Juice Newsletter brings you expert driven insights - not headlines. Every day on your inbox.

By subscribing you agree to our Terms and conditions.

Editor's Picks

EUR/USD struggles to extend advance above 1.1800

The EUR/USD pair posts a fresh weekly low near 1.1740 during the Asian trading session on Wednesday. The major currency pair is under pressure as the US Dollar edges higher despite Federal Open Market Committee minutes of the December policy meeting, released on Tuesday, showing that most policymakers stressed the need for further interest rate cuts.

GBP/USD tests 1.3450 support after moving below nine-day EMA

GBP/USD remains subdued for the second consecutive day, trading around 1.3460 during the Asian hours on Wednesday. The technical analysis of the daily chart indicates a weakening of a bullish bias as the pair is positioned slightly below the lower boundary of the ascending channel pattern.

Gold jumps on US rate cut prospects, safe-haven demand

Gold price extends the rally above $4,350 during the early European trading hours on Wednesday. Gold's price has surged about 65% this year and is set to record its biggest annual gains since 1979. The rally in the precious metal is bolstered by the prospect of further US interest rate cuts in 2026. Lower interest rates could reduce the opportunity cost of holding Gold, supporting the non-yielding precious metal.

Bitcoin, Ethereum and XRP prepare for a potential New Year rebound

Bitcoin, Ethereum, and Ripple are holding steady on Wednesday after recording minor gains on the previous day. Technically, Bitcoin could extend gains within a triangle pattern while Ethereum and Ripple face critical overhead resistance. 

Economic outlook 2026-2027 in advanced countries: Solidity test

After a year marked by global economic resilience and ending on a note of optimism, 2026 looks promising and could be a year of solid economic performance. In our baseline scenario, we expect most of the supportive factors at work in 2025 to continue to play a role in 2026.

Crypto market outlook for 2026

Year 2025 was volatile, as crypto often is.  Among positive catalysts were favourable regulatory changes in the U.S., rise of Digital Asset Treasuries (DAT), adoption of AI and tokenization of Real-World-Assets (RWA).