|

NZD/USD Price Analysis: Kiwi holds near 0.5900 amid sustained bullish signals

  • NZD/USD trades near the 0.59 zone after gaining ground during Tuesday’s session
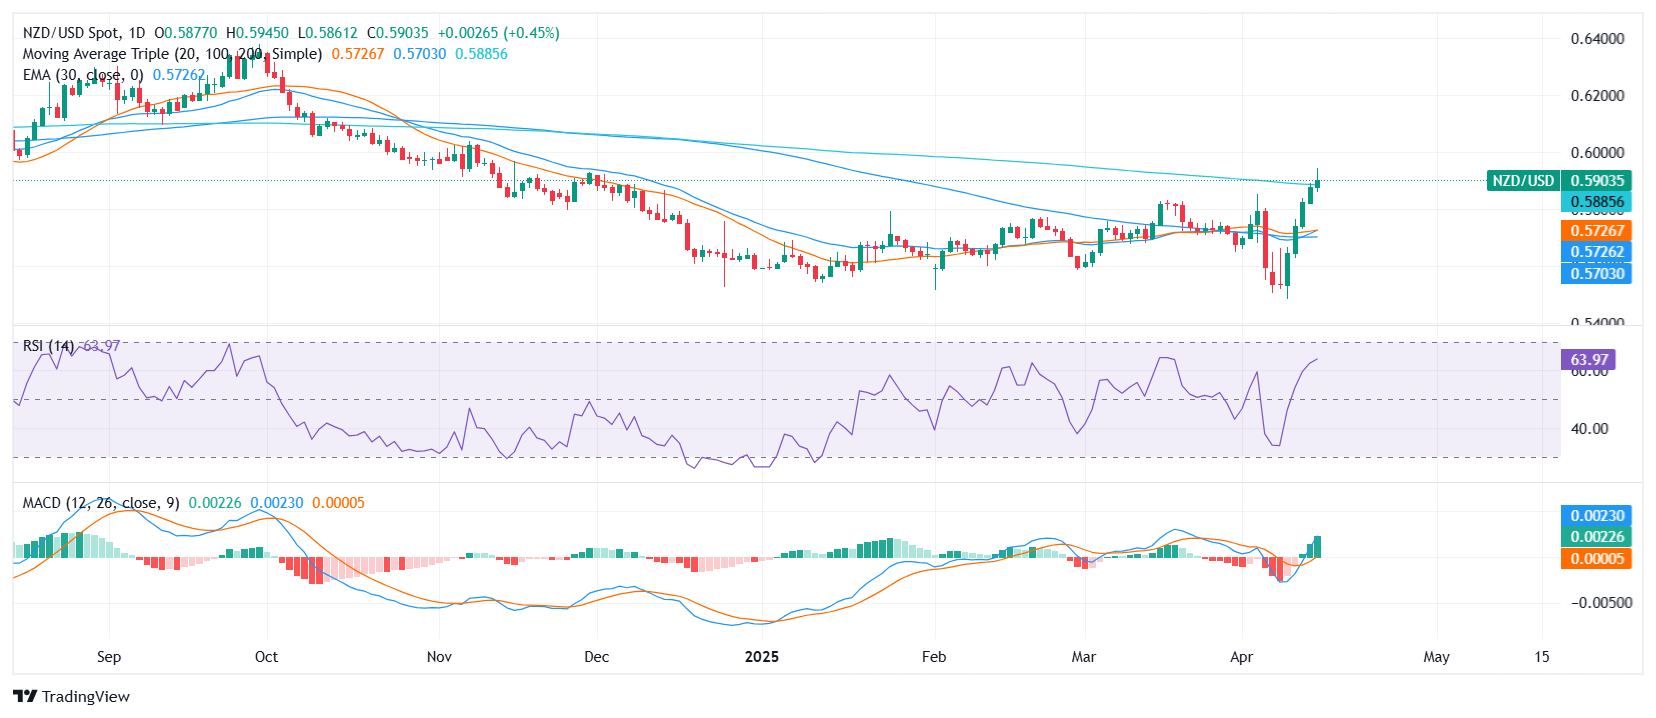
  • Technical outlook remains bullish, with key moving averages pointing north
  • Support aligns near 0.5890, with resistance seen at the 0.5910–0.5920 region

The NZD/USD pair moved higher on Tuesday, seen trading near the 0.59 area ahead of the Asian session. The Kiwi continues to benefit from sustained buying interest, holding mid-range between the day’s lows and highs, and showing resilience despite broadly neutral oscillators.

From a technical perspective, the momentum bias leans bullish. The Relative Strength Index (RSI) stands at 63.91, still in neutral territory but comfortably above the midline and mildly rising. The Moving Average Convergence Divergence (MACD) prints a green histogram bar, signaling continued bullish momentum. However, some oscillators like the Stochastic RSI Fast (100.00) and Bull Bear Power (0.03077) remain neutral, suggesting the pair may be pausing after recent gains.

Further strengthening the positive tone are the moving averages. The 10-day Exponential Moving Average at 0.57612 and 10-day Simple Moving Average at 0.57198 both signal buy. The broader trend is reinforced by the 20-day (0.57265), 100-day (0.57076), and 200-day (0.58908) Simple Moving Averages, which are all aligned to the upside and continue to offer support on dips.

Looking ahead, support rests at 0.58908, followed by 0.58413 and 0.57612. Resistance is seen at 0.59128, with a breakout above this level potentially paving the way for further gains toward the 0.5950–0.6000 region.

Daily chart

Author

Patricio Martín

Patricio is an economist from Argentina passionate about global finance and understanding the daily movements of the markets.

More from Patricio Martín
Share:

Markets move fast. We move first.

Orange Juice Newsletter brings you expert driven insights - not headlines. Every day on your inbox.

By subscribing you agree to our Terms and conditions.

Editor's Picks

EUR/USD eyes 1.1800 barrier near two-month highs

EUR/USD extends its gains for the second consecutive day on Tuesday and approaches 1.1800. On the daily chart, technical analysis indicates a persistent bullish bias, as the pair moves upward within the ascending channel pattern. Additionally, the 14-day Relative Strength Index at 68.89 reaffirms the bullish bias.

GBP/USD climbs to 1.3500 area, renews ten-week high

GBP/USD extends its weekly rally and trades at its highest level since early October near 1.3500. The US Dollar remains under persistent bearish pressure heading into the holidays, while Pound traders largely brush off the latest interest rate cut from the Bank of England.

Gold approaches $4,500 as record-setting rally continues

Gold builds on Monday's impressive gains and advances toward $4,500, setting fresh record-highs along the way. Heightened geopolitical tensions, combined with the broad-based US Dollar (USD) weakness ahead of the Q3 GDP data, help XAU/USD preserve its bullish momentum.

US GDP expected to highlight steady growth in Q3

The United States Bureau of Economic Analysis (BEA) will publish the first preliminary estimate of the third-quarter Gross Domestic Product on Tuesday, at 13:30 GMT. Analysts expect the data to show annualized growth of 3.2%, following the 3.8% expansion in the previous quarter.

Ten questions that matter going into 2026

2026 may be less about a neat “base case” and more about a regime shift—the market can reprice what matters most (growth, inflation, fiscal, geopolitics, concentration). The biggest trap is false comfort: the same trades can look defensive… right up until they become crowded.

XRP steadies above $1.90 support as fund inflows and retail demand rise

Ripple (XRP) is stable above support at $1.90 at the time of writing on Monday, after several attempts to break above the $2.00 hurdle failed to materialize last week. Meanwhile, institutional interest in the cross-border remittance token has remained steady.