|

NZD/USD Price Analysis: Kiwi extends gains near 0.5800 zone but eyes 200-day SMA hurdle

  • NZD/USD trades near the 0.5800 zone after strong gains on Friday
  • Resistance aligns with 200-day SMA near 0.5895

The NZD/USD pair extended its advance on Friday’s session with the pair seen trading near the 0.5800 zone after a 1.39% daily rise. This move positioned price mid-range between the day’s low of 0.56282 and high of 0.57656, reinforcing a bullish short-term momentum shift.

Still, the underlying trend is showing signs of strength, especially from the shorter-term averages. The 10-day exponential moving average at 0.56685 and the 10-day simple moving average at 0.56688 support the upward action. The 20-day SMA at 0.57156 and 100-day SMA at 0.57072 also lean bullish. However, traders should remain cautious of the 200-day SMA at 0.58946, which may cap further advances in the near term.

Looking ahead, support levels are seen at 0.57156, 0.57072, and 0.57068, while resistance stands at 0.57479, 0.58405, and the critical 0.58946. A daily close above the latter could cement a more sustained bullish phase.
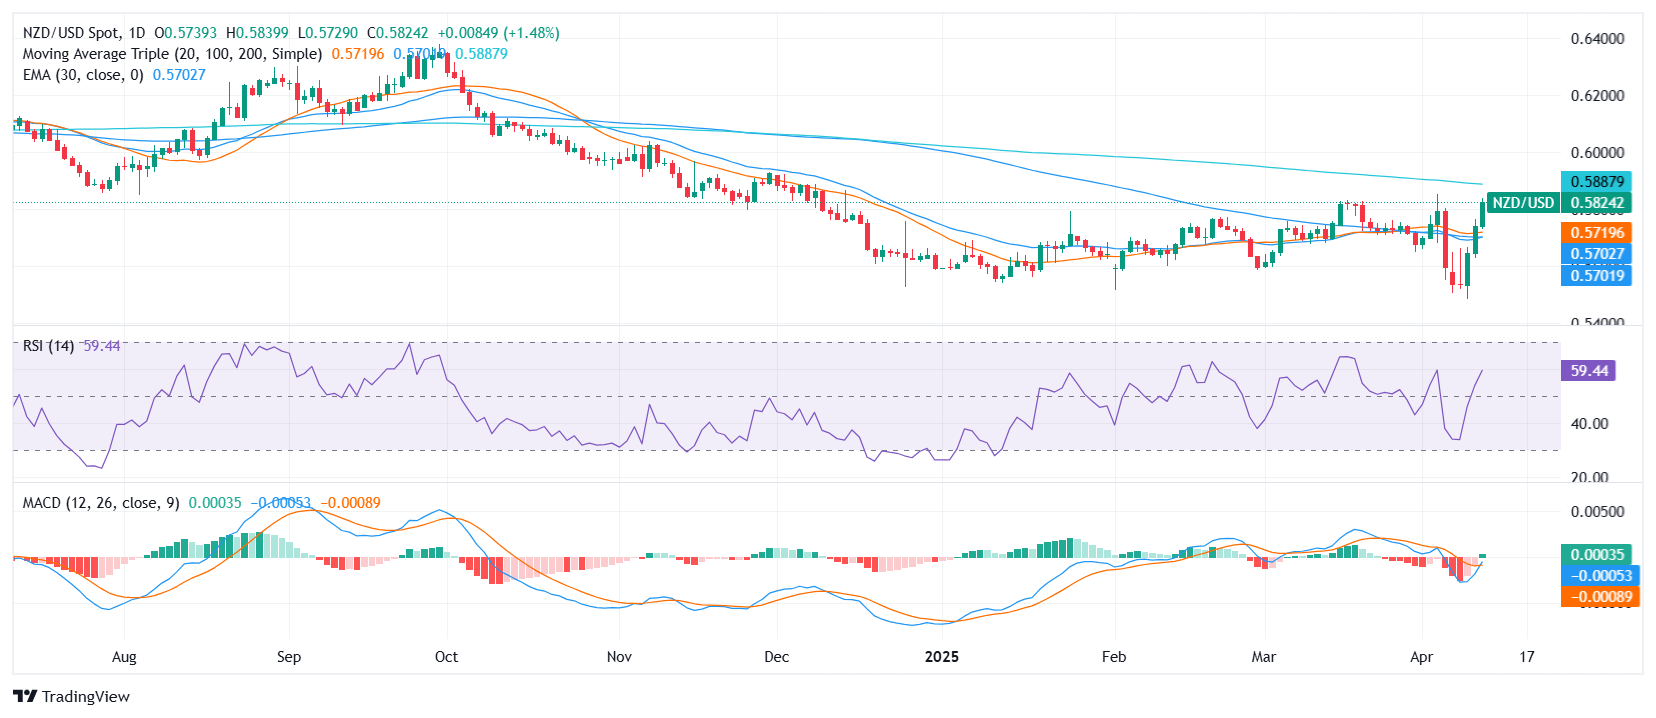
Daily chart

Author

Patricio Martín

Patricio is an economist from Argentina passionate about global finance and understanding the daily movements of the markets.

More from Patricio Martín
Share:

Editor's Picks

GBP/USD trades  near daily lows on persistent US Dollar strength

GBP/USD lost traction and declined toward 1.3150 following a short-lasting recovery attempt to the 1.3200 region in the early European session. The pair trades near its low early in the American session as US PCE inflation data came in line with expectations.

EUR/USD remains below 1.1350 after US PCE inflation

EUR/USD struggles to stage a rebound and trades in negative territory below 1.1350 on Thursday. The cautious market stance helps the US Dollar hold its ground and weighs on the pair as market participants assess the US PCE inflation report for May.

Gold struggles to stabilize above $4,000

Gold remains on the back foot, trading around $4,000 on Thursday. The commodity sticks to its bearish bias for the third straight day, and remains close to the lowest level since November 2025, touched on Wednesday.

Bitcoin tests $60,000 as whales sell off – Aave and Jupiter show resilience

The broader cryptocurrency market remains under intense selling pressure, with Bitcoin back at $60,000 for the third time this year. On-chain data shows selling pressure from large-wallet investors, commonly referred to as whales, while total liquidations hit nearly $1 billion in 24 hours.

Bitcoin nears make-or-break level ahead of US PCE data

Bitcoin recovers slightly, trading at $61,700 after reaching a new yearly low of $59,103 and a 21-month low the previous day. This bearish price action is supported by the ongoing institutional sell-off, which recorded an outflow of over $469 million on Wednesday.

Regime change: Inside Kevin Warsh's first move to make the Fed unreadable on purpose

The rate did not move. That was the least interesting thing about Kevin Warsh's first meeting in charge of the Fed. The FOMC held its benchmark at 3.50%-3.75% for the fourth straight meeting, exactly as priced, and then the new chair used his first press conference to dismantle the machinery the market has leaned on for a decade.