|

NZD/USD Price Analysis: Hovers near 0.5850 followed by nine-day EMA barrier

  • NZD/USD looks to extend losses due to the stronger US Dollar.
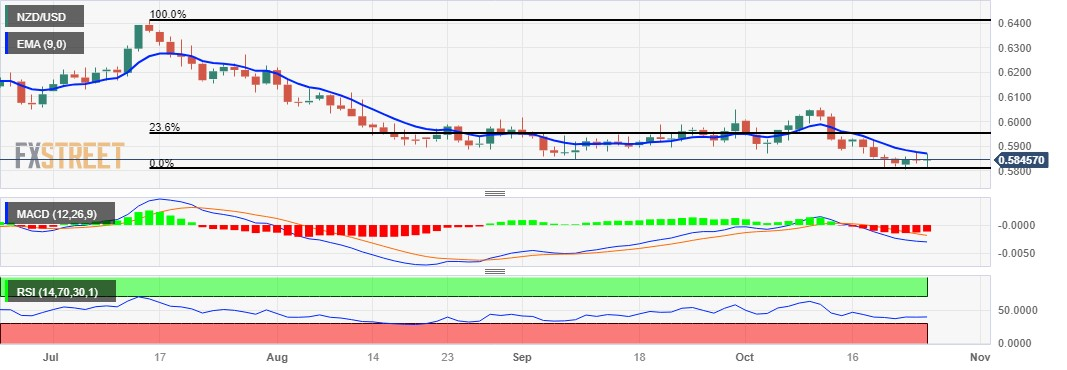
  • Technical indicators suggest a bearish sentiment in the pair.
  • Major level at 0.5800 aligned with the monthly low could act again as support.

NZD/USD struggles to remain in the positive territory after minor losses registered in the previous session due to weaker upbeat S&P Global PMI from the United States (US).

US S&P Global Composite PMI showed growth in October, rising from 50.2 to 51.0. The Services PMI experienced an increase, reaching 50.9, while the Manufacturing PMI rose to 50.0. The manufacturing index has maintained a level above the 50-point threshold in the last six months, indicating a positive shift in that sector.

NZD/USD trades around the 0.5850 psychological level during the European session on Wednesday. The pair has almost trimmed its intraday gains as the US Dollar (USD) continues the gains for the second successive day.

The nine-day Exponential Moving Average (EMA) at 0.5870 appears to be the key barrier, followed by the 0.5900 psychological level.

A firm break above the latter could open the doors for the NZD/USD pair to explore the region around the 23.6% Fibonacci retracement at 0.5950.

On the downside, the region around the major level at 0.5800 aligned with the monthly low at 0.5807 could act again as the immediate support for the NZD/USD pair.

The Moving Average Convergence Divergence (MACD) line remains beneath both the centerline and the signal line. The financial sonnet echoes a bearish refrain for the NZD/USD pair.

Furthermore, the NZD/USD pair unveils a bearish momentum, as the 14-day Relative Strength Index (RSI) flaunts a palpable penchant for weakness, gracefully bowing beneath the 50 level.

NZD/USD: Daily Chart

NZD/USD: Additional levels to watch

Overview
Today last price0.5846
Today Daily Change0.0002
Today Daily Change %0.03
Today daily open0.5844
 
Trends
Daily SMA200.5927
Daily SMA500.5927
Daily SMA1000.6044
Daily SMA2000.6144
 
Levels
Previous Daily High0.5874
Previous Daily Low0.5828
Previous Weekly High0.5931
Previous Weekly Low0.5815
Previous Monthly High0.605
Previous Monthly Low0.5847
Daily Fibonacci 38.2%0.5846
Daily Fibonacci 61.8%0.5856
Daily Pivot Point S10.5823
Daily Pivot Point S20.5803
Daily Pivot Point S30.5777
Daily Pivot Point R10.5869
Daily Pivot Point R20.5895
Daily Pivot Point R30.5915

Author

Akhtar Faruqui

Akhtar Faruqui is a Forex Analyst based in New Delhi, India. With a keen eye for market trends and a passion for dissecting complex financial dynamics, he is dedicated to delivering accurate and insightful Forex news and analysis.

More from Akhtar Faruqui
Share:

Editor's Picks

EUR/USD recovers above 1.1600 as focus shifts to US NFP

EUR/USD recovers ground above 1.1600 in Friday's European trading. The pair's uptick is sponsored by a profit-taking pullback in the US Dollar, as traders reposition ahead of the critical US Nonfarm Payrolls data. Meanwhile, the Middle East conflict and higher oil prices could keep the recovery in check. 

GBP/USD rebounds toward 1.3400 in countdown to US NFP

GBP/USD is rebounding toward 1.3400 in the European session on Friday. A modest improvement in risk sentiment and a broad-based US Dollar retreat help the pair recover its weekly losses. The focus now remains on the US NFP data and Middle East headlines for fresh trading incentives. 

Gold advances on increased safe-haven demand

Gold price recovers its recent losses from the previous session. The yellow metal advances as the broader precious metals market rebounds on safe-haven demand. However, the yellow metal is on track for its first weekly decline in five weeks as escalating Middle East tensions push oil prices higher, fueling inflation concerns and reducing bets on Federal Reserve rate cuts.

Bitcoin, Ethereum and Ripple at risk as US-Iran war extends

Bitcoin, Ethereum, and Ripple trade cautiously at press time on Friday, close to key support levels after a roughly 2% pullback the previous day. Bitcoin holds above $71,000, Ethereum at $2,000, and XRP continues to consolidate in a sideways range.

The market compass is pointing at a barrel of Oil

The Asian open is arriving with equities leaning the wrong way, and the reason is not complicated. The market’s compass needle has snapped firmly toward crude. In this tape, oil is not just another input price; it is the gravitational center around which every asset class is orbiting.

Top 3 Price Prediction: Bitcoin, Ethereum, Ripple at risk as US-Iran war extends

Bitcoin, Ethereum, and Ripple trade cautiously at press time on Friday, close to key support levels after a roughly 2% pullback the previous day. Bitcoin holds above $71,000, Ethereum at $2,000, and XRP continues to consolidate in a sideways range.