|

NZD/USD Price Analysis: Fades bounce off weekly support line, sellers eye 0.7300

  • NZD/USD remains on the back-foot, fails to break above 100-HMA.
  • 200-HMA follows a confluence of key support line, 50% Fibonacci retracement to test bears.
  • Bulls need confirmation from 0.7420 to retake controls.

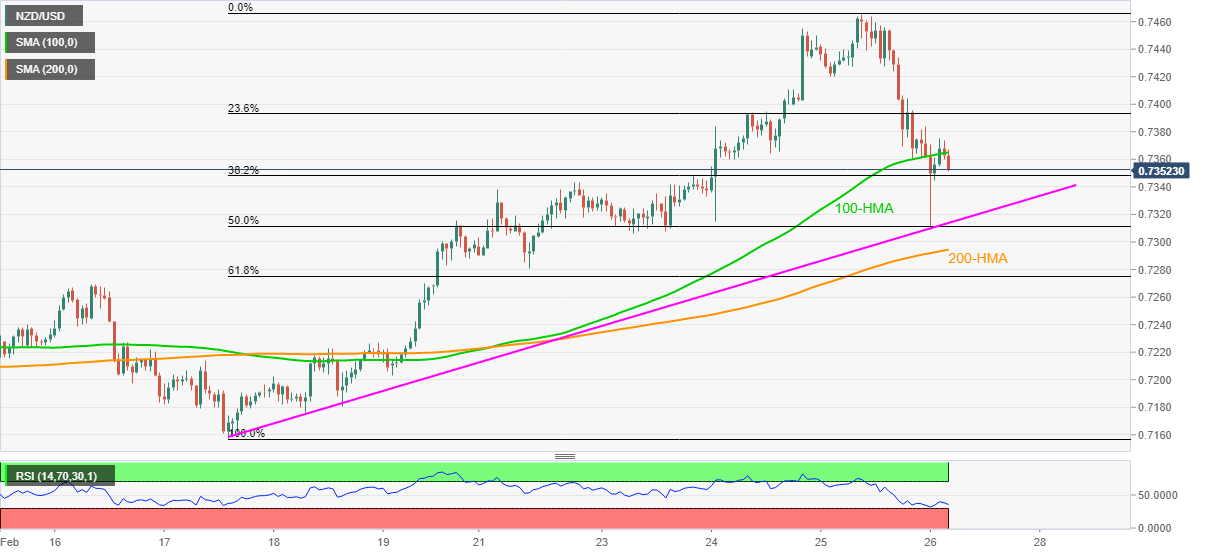
NZD/USD drops to 0.7354 in a fresh pullback from the latest swing top of 0.7375, down 0.18% intraday, during early Friday.

The kiwi pair staged a corrective pullback from a one-week-old support line, coupled with a 50% Fibonacci retracement level of February 17-25 upside, amid oversold RSI. However, failures to sustain a break of 100-HMA seem to trigger the recent weakness.

NZD/USD sellers currently target the 0.7310 support convergence having the stated trend line and Fibonacci retracement level. Though, any further weakness will be tamed by a 200-HMA level of 0.7295.

On the contrary, fresh recovery moves not only need to cross the 100-HMA level of 0.7365 but also the early Thursday lows near 0.7420 to recall the NZD/USD buyers.

Following that, the latest high, also the highest since August 2017, will challenge the Kiwi bulls around 0.7465.

NZD/USD hourly chart

Trend: Further weakness expected

Additional important levels

Overview
Today last price0.7353
Today Daily Change-15 pips
Today Daily Change %-0.20%
Today daily open0.7368
 
Trends
Daily SMA200.7241
Daily SMA500.719
Daily SMA1000.702
Daily SMA2000.6787
 
Levels
Previous Daily High0.7466
Previous Daily Low0.736
Previous Weekly High0.7316
Previous Weekly Low0.7158
Previous Monthly High0.7316
Previous Monthly Low0.7096
Daily Fibonacci 38.2%0.74
Daily Fibonacci 61.8%0.7425
Daily Pivot Point S10.733
Daily Pivot Point S20.7292
Daily Pivot Point S30.7224
Daily Pivot Point R10.7436
Daily Pivot Point R20.7504
Daily Pivot Point R30.7542

Author

Anil Panchal

Anil Panchal

FXStreet

Anil Panchal has nearly 15 years of experience in tracking financial markets. With a keen interest in macroeconomics, Anil aptly tracks global news/updates and stays well-informed about the global financial moves and their implications.

More from Anil Panchal
Share:

Editor's Picks

EUR/USD looks to regain the 200-day SMA

EUR/USD regains some balance and trade just above 1.1600 the figure ahead of the opening bell in Asia. The pair initially dipped to the 1.1530 zone for the first time since November, always following the stronger US Dollar and the marked flight-to-safety in the context of the ongoing Middle East crisis
 

GBP/USD attacks 1.3300, refreshing three-month lows

GBP/USD is deep in the red near 1.3300, accelerating its downside to renew three-month lows in European trading on Tuesday. The ongoing escalation in the Iran war, combined with rising Oil prices, weighs negatively on the higher-yielding Pound Sterling as the US Dollar capitalizes on increased haven demand.

Gold bounces off lows, back above $5,100

Gold remains on the defensive, eroding part of the recent multi-day advance and managing to trade back above the $5,100 mark per troy ounce on Tuesday. The precious metal initially dropped just below the critical $5,000 threshold on the back of the persistent strength of the Greenback, higher US Treasury yields across the curve and investors' repricing of Fed rate cuts.

XRP risks extending losses as US-Iran war rages on

Ripple (XRP) has come under pressure, drifting lower to $1.35 at the time of writing on Tuesday. The over 2% correction looks poised to erase the previous day’s gains, which lifted the remittance token to $1.42.

Energy shock 2.0: Why rising Gas prices could hit the Euro

Even without a confirmed, sustained disruption, the mere risk to a key global energy chokepoint is enough to inject a significant premium into European Gas markets. And for the Euro, that matters.

Ripple falters amid sell-off jitters and negative funding rates

Ripple (XRP) has come under pressure, drifting lower to $1.35 at the time of writing on Tuesday. The over 2% correction looks poised to erase the previous day’s gains, which lifted the remittance token to $1.42.