NZD/USD Price Analysis: Extend its rally to three days though retreats from 0.6890 to 0.6860s


  • The New Zealand dollar extends its rally to four days as the Asian session begins.
  • A risk-off market mood did not stop the NZD rise towards a fresh YTD high.
  • NZD/USD Technical Outlook: It has a neutral bias though if NZD bulls reclaim 0.6960, an attack towards the 200-DMA is on the cards.

The New Zealand dollar slightly advances for the fourth day in a row, extending its weekly rally. On the day, the NZD/USD pair surges some 0.01%, exchanges hands at 0.6859 at the time of writing. The leading cause of the rally is broad US dollar weakness, according to Joel Frank, an analyst at FX Street, spurred “by a long-squeeze/bout of profit-taking, goes against recent fundamental developments that many would normally see as USD bullish.”

NZD/USD Price Forecast: Technical outlook

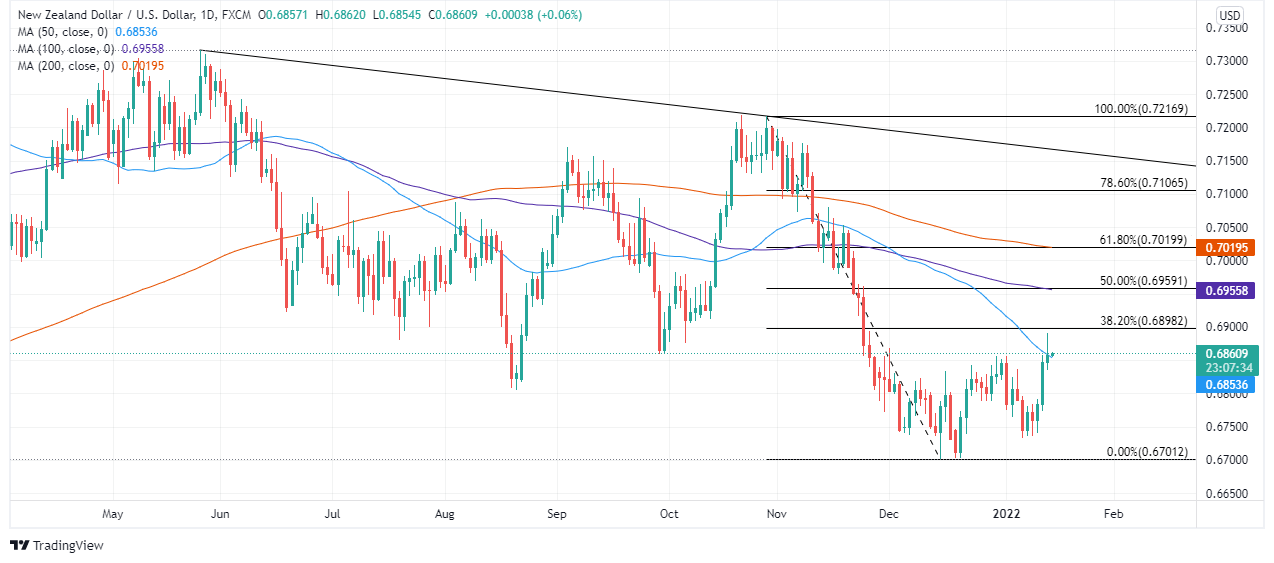
On Thursday, during the overnight session for North American traders, the NZD/USD was subdued around the 0.6840-60 region until mixed US macroeconomic data triggered another leg-up, reaching a daily high at 0.6890. The rally stalled at the 0.6900 figure, which confluences with a 38.2% Fibonacci retracement, drawn from November – December 2021 cycle high/lows, retreating above the 50-day moving average (DMA).

The NZD/USD first ceiling level is the 38.2% Fibonacci retracement. A breach of the latter will expose the 50% Fibonacci level at 0.6960, followed by the 61.8% Fibonacci retracement at 0.7019.

Conversely, NZD bull’s first line of defense would be the 0.6800 figure. A clear break of it will send the pair tumbling to the January 6 daily low at 0.6733, followed by 2021 yearly low at 0.6702.

Tradingview

NZD/USD

Overview
Today last price 0.6859
Today Daily Change 0.0003
Today Daily Change % 0.04
Today daily open 0.6856
 
Trends
Daily SMA20 0.6795
Daily SMA50 0.6866
Daily SMA100 0.6962
Daily SMA200 0.7025
 
Levels
Previous Daily High 0.6858
Previous Daily Low 0.6773
Previous Weekly High 0.6857
Previous Weekly Low 0.6733
Previous Monthly High 0.6891
Previous Monthly Low 0.6701
Daily Fibonacci 38.2% 0.6825
Daily Fibonacci 61.8% 0.6805
Daily Pivot Point S1 0.68
Daily Pivot Point S2 0.6744
Daily Pivot Point S3 0.6715
Daily Pivot Point R1 0.6885
Daily Pivot Point R2 0.6914
Daily Pivot Point R3 0.697


Share: Feed news

Information on these pages contains forward-looking statements that involve risks and uncertainties. Markets and instruments profiled on this page are for informational purposes only and should not in any way come across as a recommendation to buy or sell in these assets. You should do your own thorough research before making any investment decisions. FXStreet does not in any way guarantee that this information is free from mistakes, errors, or material misstatements. It also does not guarantee that this information is of a timely nature. Investing in Open Markets involves a great deal of risk, including the loss of all or a portion of your investment, as well as emotional distress. All risks, losses and costs associated with investing, including total loss of principal, are your responsibility. The views and opinions expressed in this article are those of the authors and do not necessarily reflect the official policy or position of FXStreet nor its advertisers. The author will not be held responsible for information that is found at the end of links posted on this page.

If not otherwise explicitly mentioned in the body of the article, at the time of writing, the author has no position in any stock mentioned in this article and no business relationship with any company mentioned. The author has not received compensation for writing this article, other than from FXStreet.

FXStreet and the author do not provide personalized recommendations. The author makes no representations as to the accuracy, completeness, or suitability of this information. FXStreet and the author will not be liable for any errors, omissions or any losses, injuries or damages arising from this information and its display or use. Errors and omissions excepted.

The author and FXStreet are not registered investment advisors and nothing in this article is intended to be investment advice.

Recommended content


Recommended content

Editors’ Picks

EUR/USD clings to daily gains above 1.0650

EUR/USD clings to daily gains above 1.0650

EUR/USD gained traction and turned positive on the day above 1.0650. The improvement seen in risk mood following the earlier flight to safety weighs on the US Dollar ahead of the weekend and helps the pair push higher.

EUR/USD News

GBP/USD recovers toward 1.2450 after UK Retail Sales data

GBP/USD recovers toward 1.2450 after UK Retail Sales data

GBP/USD reversed its direction and advanced to the 1.2450 area after touching a fresh multi-month low below 1.2400 in the Asian session. The positive shift seen in risk mood on easing fears over a deepening Iran-Israel conflict supports the pair.

GBP/USD News

Gold holds steady at around $2,380 following earlier spike

Gold holds steady at around $2,380 following earlier spike

Gold stabilized near $2,380 after spiking above $2,400 with the immediate reaction to reports of Israel striking Iran. Meanwhile, the pullback seen in the US Treasury bond yields helps XAU/USD hold its ground.

Gold News

Bitcoin Weekly Forecast: BTC post-halving rally could be partially priced in Premium

Bitcoin Weekly Forecast: BTC post-halving rally could be partially priced in

Bitcoin price shows no signs of directional bias while it holds above  $60,000. The fourth BTC halving is partially priced in, according to Deutsche Bank’s research. 

Read more

Week ahead – US GDP and BoJ decision on top of next week’s agenda

Week ahead – US GDP and BoJ decision on top of next week’s agenda

US GDP, core PCE and PMIs the next tests for the Dollar. Investors await BoJ for guidance about next rate hike. EU and UK PMIs, as well as Australian CPIs also on tap.

Read more

Forex MAJORS

Cryptocurrencies

Signatures