|

NZD/USD Price Analysis: Drops to 0.5630, extending its bearish streak

  • NZD/USD falls on Thursday, settling near 0.5630 and hitting new multi-year lows.
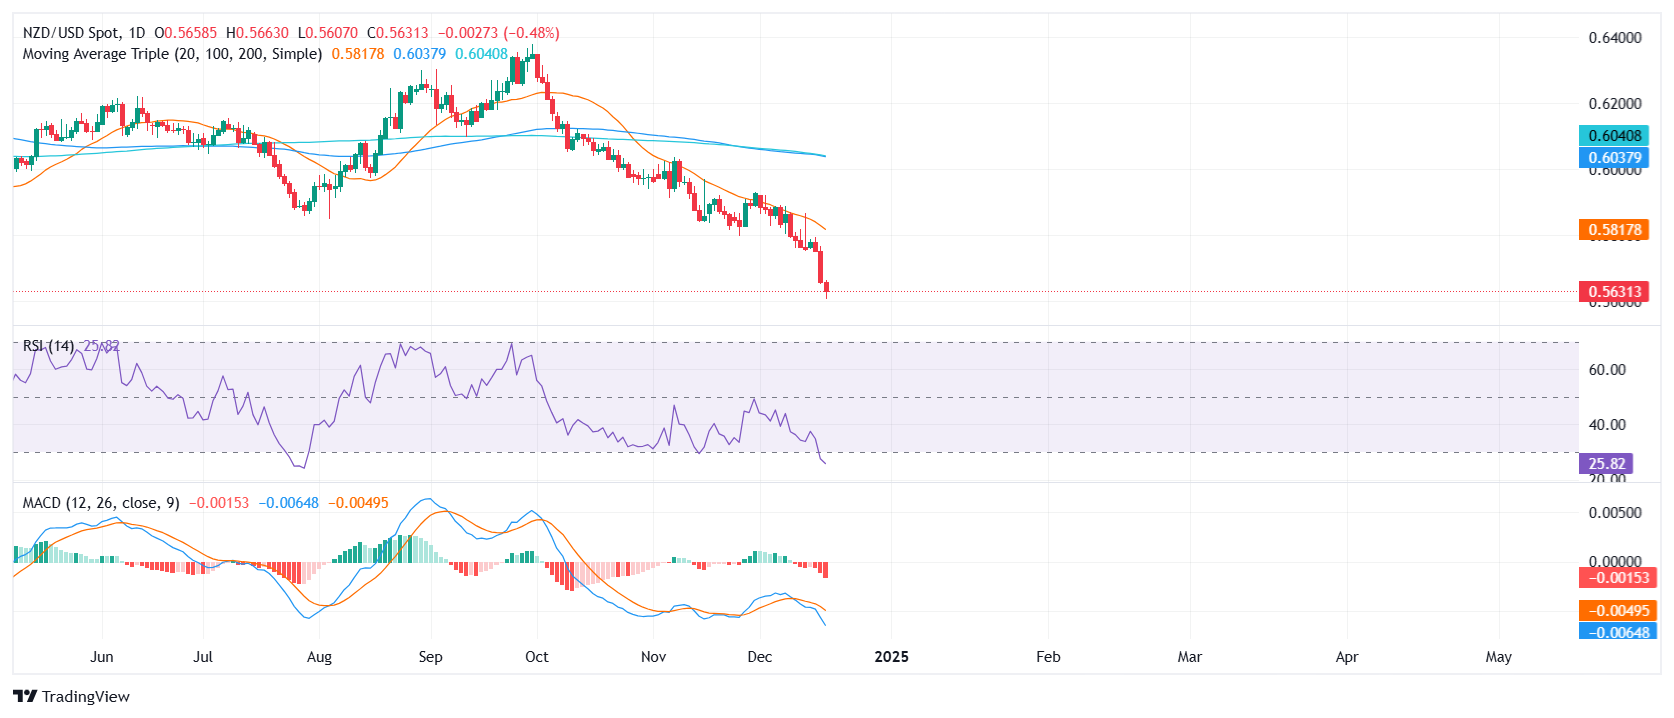
  • Pair remains well below the 20-day SMA, reinforcing the entrenched bearish trend at its lowest levels since October 2022.
  • RSI stands at 26 in oversold territory, offering little hope of a reversal, while MACD histogram shows rising red bars, indicating persistent selling pressure.

The NZD/USD pair extended its downtrend on Thursday, slipping by 0.36% to approximately 0.5630, a fresh multi-year low. Efforts by the bulls to stage any meaningful recovery continue to falter, as the 20-day Simple Moving Average (SMA), hovering around 0.5890, remains a distant target and a key barrier to halting the decline.

Technical indicators underscore the dire state of affairs. The Relative Strength Index (RSI) at 26 confirms oversold conditions, yet its inability to rebound suggests persistent downward momentum. Meanwhile, the Moving Average Convergence Divergence (MACD) histogram prints rising red bars, further cementing the bearish outlook and reducing the likelihood of a near-term turnaround.

As long as NZD/USD lingers below the 20-day SMA, the overall bias remains clearly negative. With no clear support levels nearby, the pair could face additional downside risks, keeping sellers firmly in control of the market’s direction.

NZD/USD daily chart

Author

Patricio Martín

Patricio is an economist from Argentina passionate about global finance and understanding the daily movements of the markets.

More from Patricio Martín
Share:

Editor's Picks

AUD/USD regains mild traction, falters near 0.7150

AUD/USD gathers some steam and manages to flirt with the 0.7150 level on Thursday. However, the pair has retraced some of Wednesday’s significant pullback due to renewed selling pressure on the Greenback and a slight improvement in risk sentiment following hopes of a deal in the Middle East. Wrapping up the Australian docket, the RBA’s Hauser will speak early on Friday.

USD/JPY: Japanese Yen coiled at the line, leaning on everyone but Japan

The Yen is doing very little, and that stasis is the whole story. USD/JPY sits glued near 160.00 not because Japan has found new strength, but because two outside forces are fighting to a draw over it: a US rate complex that keeps the dollar bid, and a Ministry of Finance that refuses to let the line break.

Gold puts its 200-day SMA to the test near $4,420

Gold keeps the bullish stance in place in the latter part of Thursday’s session, although a convincing break above the key $4,500 mark per troy ounce still remains elusive. The precious metal’s advance comes amid the resurgence of some selling interest around the Greenback, improving risk sentiment, and declining US Treasury yields across the board.

Bitcoin falls below $64K as demand turns negative, short-term holders' selling intensifies

Bitcoin has fallen below $64,000 on Thursday amid weakening market demand and mounting selling pressure from short-term holders. The leading cryptocurrency slipped toward the $63,000 level amid a broader risk-off environment, with several key metrics signaling one of the most challenging periods of the current market cycle.

Nonfarm payrolls: Testing the limits of Fed policy patience

The upcoming nonfarm payrolls report for May will provide the final update on the US labor market before Kevin Warsh attends his first policy meeting as the new Fed Chair later this month.

Recession on paper: What really moves the Canadian Loonie now?

Statistics Canada handed the headline writers a gift and the analysts a headache. Real GDP shrank 0.1% on an annualized basis in the first quarter, and with the fourth quarter of 2025 revised down to a 1.0% contraction, that is two negative quarters in a row, the textbook definition of a technical recession and Canada's first since the pandemic.