|

NZD/USD Price Analysis: Consolidates in a narrowing price range

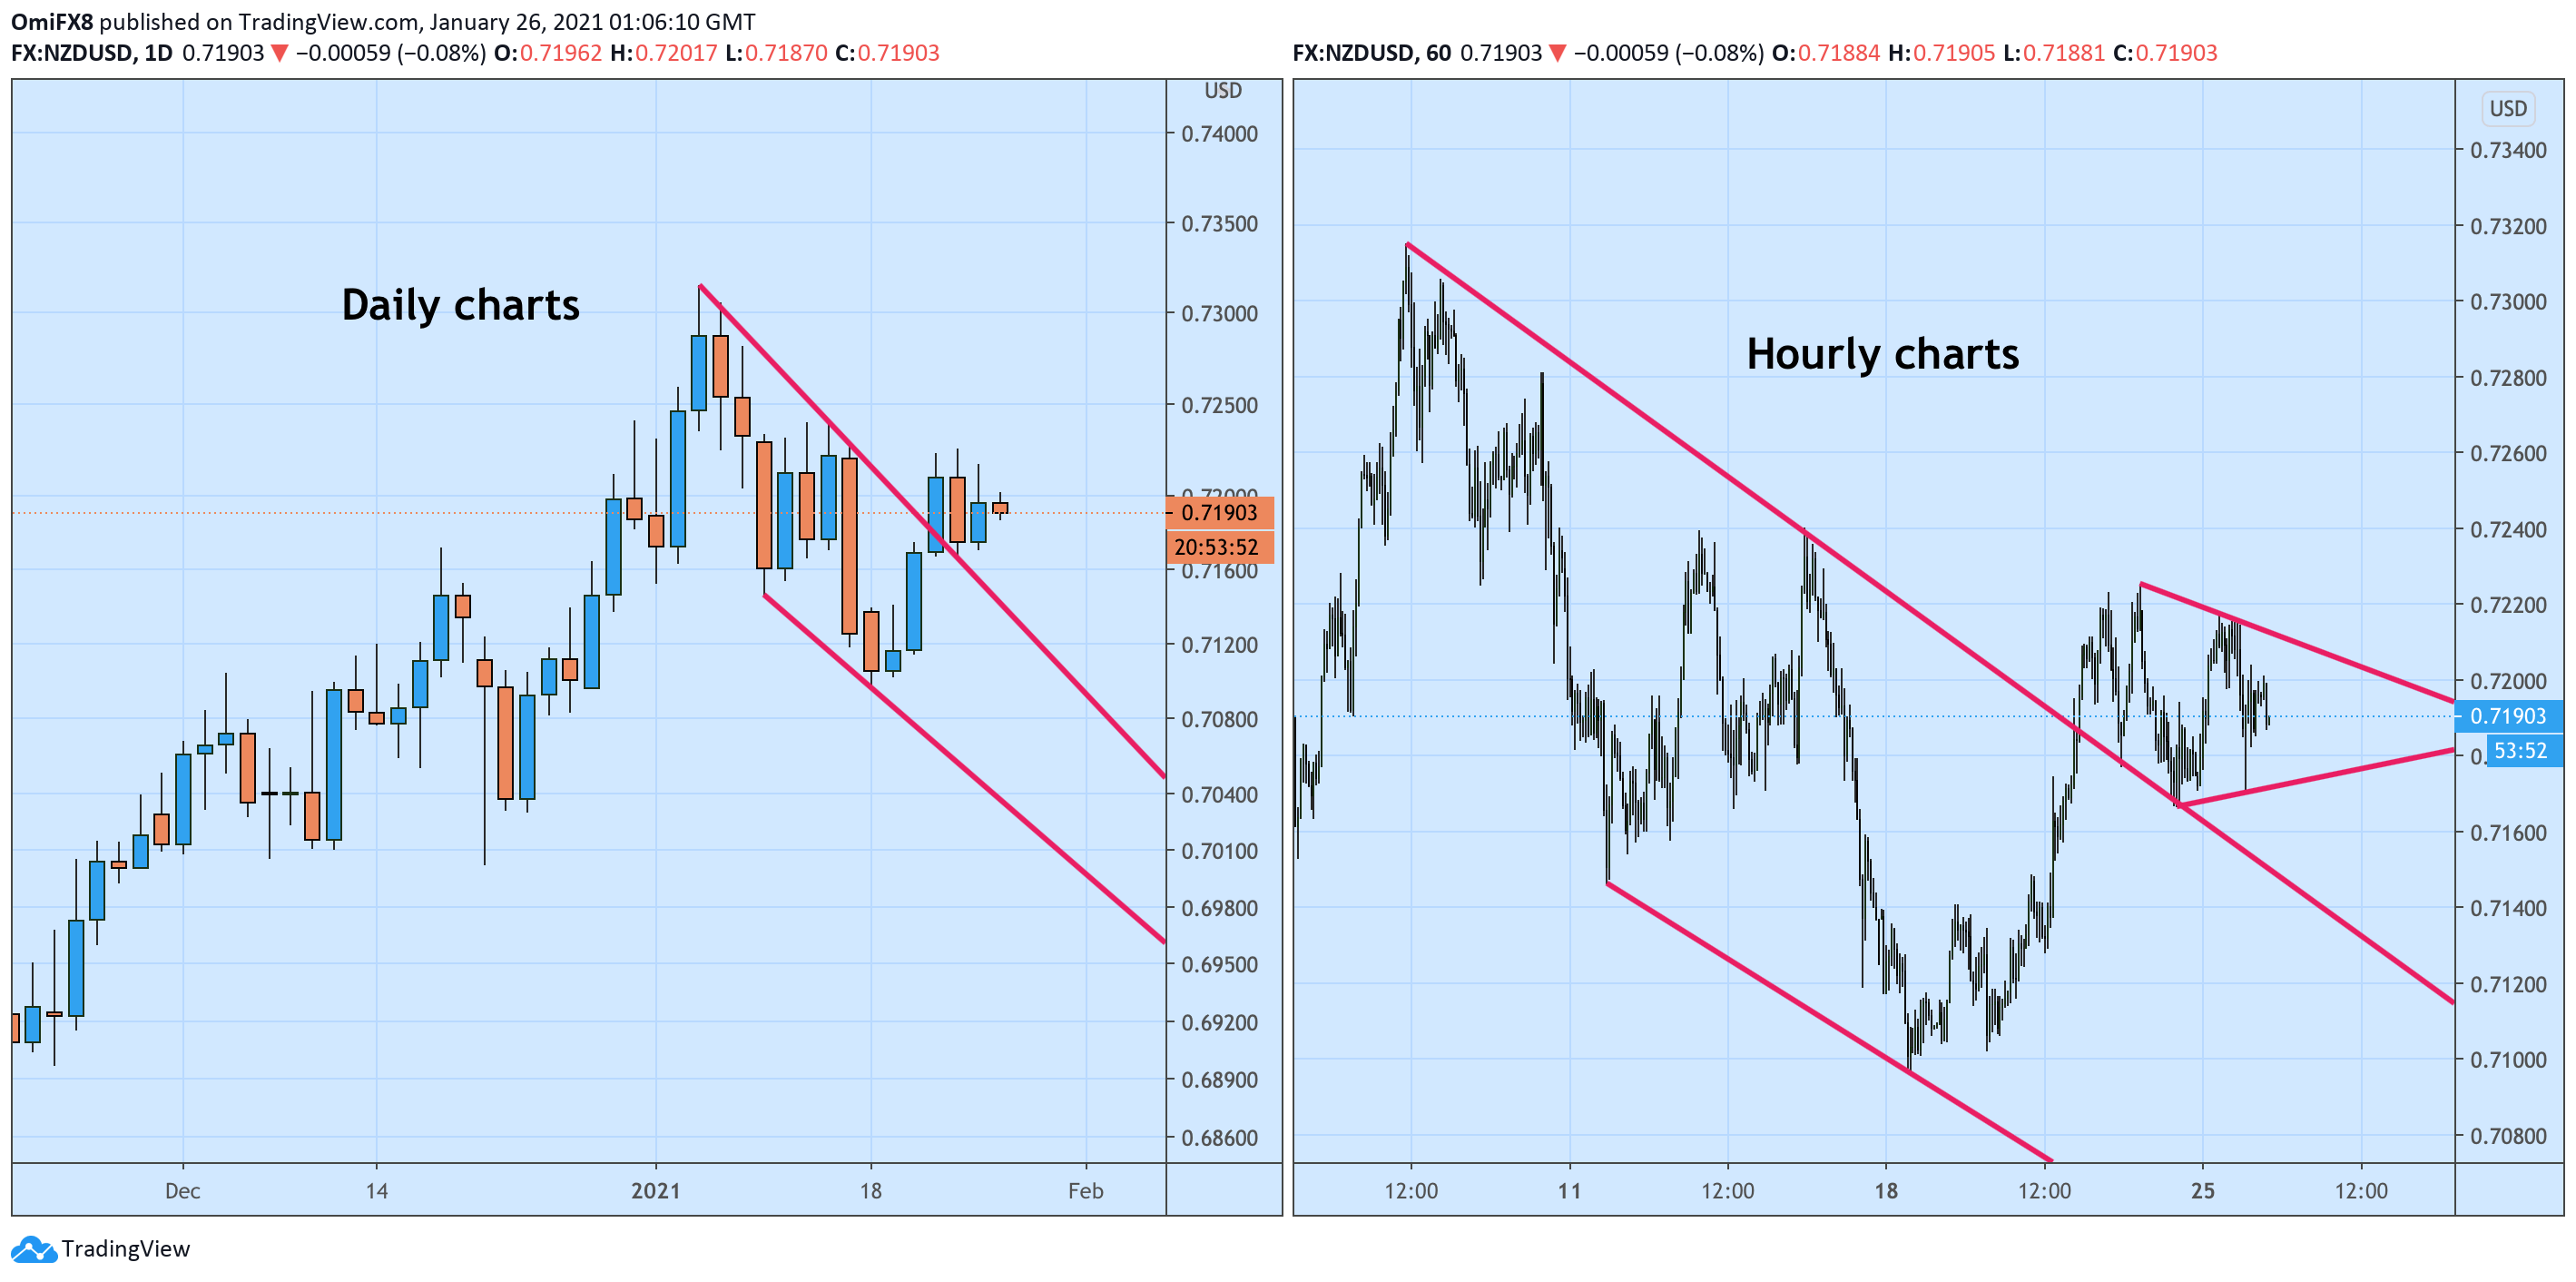
  • NZD/USD's hourly chart shows a contracting triangle pattern. 
  • A breakout would validate the bullish pattern seen on the daily chart.

NZD/USD has created a narrowing price range over the past 48 hours or so, marking a weak follow-through to a bullish falling channel breakout confirmed by Thursday's 0.51% gain. 

The immediate bias will remain neutral as long as the pair is trapped in the contracting triangle (narrowing price range) seen on the hourly chart. A move above the top end of the triangle, currently at 0.7212, would validate the daily chart falling channel breakout confirmed last week and open the doors for a re-test of the Jan. 6 high of 0.7315. 

Alternatively, a range breakdown would shift risk in favor of a drop to the Jan. 18 low of 0.7096. 

Daily and hourly charts

Trend: Neutral

Technical levels

NZD/USD

Overview
Today last price0.7189
Today Daily Change-0.0007
Today Daily Change %-0.10
Today daily open0.7196
 
Trends
Daily SMA200.7168
Daily SMA500.7093
Daily SMA1000.6883
Daily SMA2000.6651
 
Levels
Previous Daily High0.7217
Previous Daily Low0.7171
Previous Weekly High0.7226
Previous Weekly Low0.7096
Previous Monthly High0.7241
Previous Monthly Low0.7002
Daily Fibonacci 38.2%0.7199
Daily Fibonacci 61.8%0.7188
Daily Pivot Point S10.7172
Daily Pivot Point S20.7148
Daily Pivot Point S30.7126
Daily Pivot Point R10.7219
Daily Pivot Point R20.7241
Daily Pivot Point R30.7265

Author

Omkar Godbole

Omkar Godbole

FXStreet Contributor

Omkar Godbole, editor and analyst, joined FXStreet after four years as a research analyst at several Indian brokerage companies.

More from Omkar Godbole
Share:

Editor's Picks

EUR/USD hovers around nine-day EMA above 1.1800

EUR/USD gains ground for the second successive session, trading around 1.1820 during the Asian hours on Monday. The 14-day Relative Strength Index momentum indicator stands at 51 (neutral) after recovering above the midline, indicating stabilizing momentum. 

GBP/USD gathers strength above 1.3500 amid tariff confusion

The GBP/USD pair gains traction to around 1.3520 during the early Asian session on Monday. The US Dollar faces some selling pressure against the Cable as tariff uncertainty lingers. Traders will take more cues from the US Producer Price Index report for January, which will be published later on Friday. 

Gold climbs to fresh monthly high on trade war fears, geopolitical risks, weaker USD

Gold registered its highest-ever weekly close, above the $5,100 mark on Friday, and gains strong follow-through traction at the start of a new week. This also marks the fourth straight day of a positive move and lifts the commodity beyond the $5,150 level, or a fresh monthly peak, during the Asian session. 

Cardano braces for impact as US tariff storm brews

Cardano is down 4% at press time on Monday, entering its third consecutive day of decline. Bearish bias in Cardano’s derivatives market positional buildup aligns with rising pressure on the broader cryptocurrencymarket amid US President Donald Trump's reassessment of global tariffs and domestic conflict with the US Supreme Court. 

Liberation day take two, the tariff machine just changed gears

Let me caveat this from the outset. What we are watching is first-order mechanics, not the grand macro endgame. This is the market’s immediate reflex to a 15% Trump tariff levy dressed up as judicial drama. The Supreme Court blocked Trump tarrif hammer. The White House came back with a scalpel.

Top Crypto Losers: Zcash, Pump.fun, and LayerZero extended losses as Bitcoin loses $65,000

The cryptocurrency market starts the week in panic mode, with altcoins Zcash, Pump.fun, and LayerZero. Bitcoin falls below $65,000 as the US President Donald Trump regroups amid renewed trade policy risks.