NZD/USD Price Analysis: Bulls target 0.7100 amid falling wedge breakout, NZ jobs blowout


  • NZD/USD yields a big technical breakout on the daily chart.
  • NZD bulls gear up for a test of 0.7100 as 50-DMA resistance caves in.
  • New Zealand’s jobless rate drops sharply to 4% in Q2, seals an RBNZ rate hike this year.

NZD/USD is flirting with monthly tops near 0.7067, rallying hard on stronger-than-expected New Zealand’s employment data for the second quarter.

The jobless rate in the South Pacific Island nation dropped sharply to 4% in Q2 vs. 4.5% expected, confirming an RBNZ rate hike later this year.

Further, an improvement in the risk sentiment also lends support to the kiwi bulls, as all eyes now turn towards the US ADP and ISM Services PMI report for fresh trading incentives.

Looking at the daily technical graph for the kiwi, the price confirmed a falling wedge breakout on closing Tuesday above 0.7014, with the jobs blowout offering extra zest to the NZD bulls, as they storm through the bearish 50-Daily Moving Average (DMA) at 0.7054.

The 14-day Relative Strength Index (RSI) is pointing higher above the midline, suggesting that there is more room for the upside.

Therefore, the buyers target the confluence of the 100 and 200-DMAs at 0.7100.

The upside breakout has defied a warning of a bear cross, as 100-DMA cut through the 200-DMA from above a day before.

NZD/USD daily chart

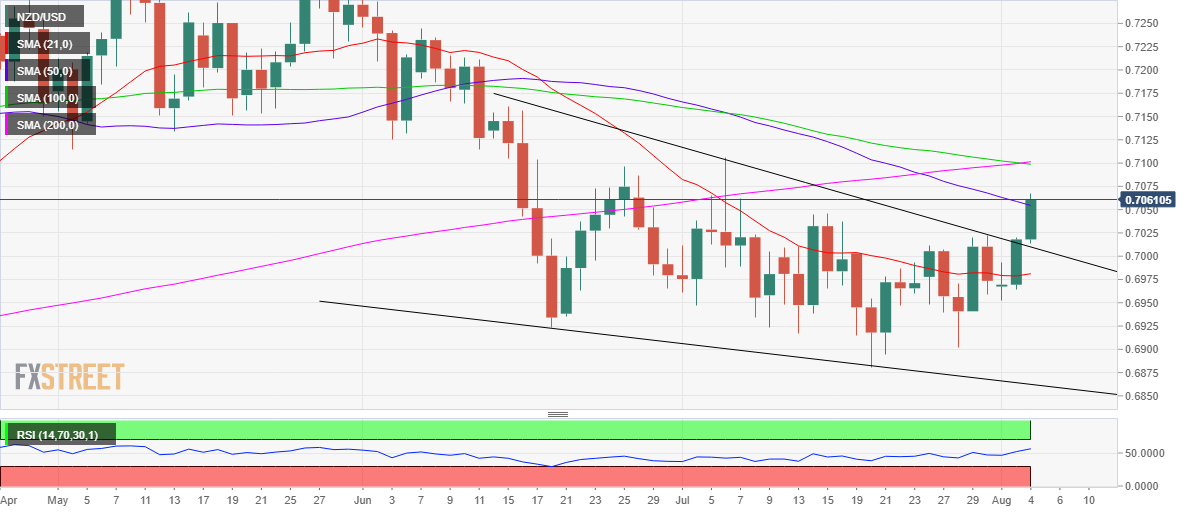
Alternatively, if the bulls fail to find acceptance above 50-DMA, then a retracement towards the wedge resistance now support, now at 0.7010, cannot be ruled out.

The next relevant downside target for kiwi sellers is seen at the horizontal 21-DMA at 0.6981.

NZD/USD additional levels to watch

NZD/USD

Overview
Today last price 0.7065
Today Daily Change 0.0046
Today Daily Change % 0.66
Today daily open 0.7018
 
Trends
Daily SMA20 0.6977
Daily SMA50 0.7059
Daily SMA100 0.7101
Daily SMA200 0.7097
 
Levels
Previous Daily High 0.702
Previous Daily Low 0.6964
Previous Weekly High 0.7022
Previous Weekly Low 0.6902
Previous Monthly High 0.7106
Previous Monthly Low 0.6881
Daily Fibonacci 38.2% 0.6999
Daily Fibonacci 61.8% 0.6985
Daily Pivot Point S1 0.6981
Daily Pivot Point S2 0.6945
Daily Pivot Point S3 0.6925
Daily Pivot Point R1 0.7037
Daily Pivot Point R2 0.7057
Daily Pivot Point R3 0.7093


Share: Feed news

Information on these pages contains forward-looking statements that involve risks and uncertainties. Markets and instruments profiled on this page are for informational purposes only and should not in any way come across as a recommendation to buy or sell in these assets. You should do your own thorough research before making any investment decisions. FXStreet does not in any way guarantee that this information is free from mistakes, errors, or material misstatements. It also does not guarantee that this information is of a timely nature. Investing in Open Markets involves a great deal of risk, including the loss of all or a portion of your investment, as well as emotional distress. All risks, losses and costs associated with investing, including total loss of principal, are your responsibility. The views and opinions expressed in this article are those of the authors and do not necessarily reflect the official policy or position of FXStreet nor its advertisers. The author will not be held responsible for information that is found at the end of links posted on this page.

If not otherwise explicitly mentioned in the body of the article, at the time of writing, the author has no position in any stock mentioned in this article and no business relationship with any company mentioned. The author has not received compensation for writing this article, other than from FXStreet.

FXStreet and the author do not provide personalized recommendations. The author makes no representations as to the accuracy, completeness, or suitability of this information. FXStreet and the author will not be liable for any errors, omissions or any losses, injuries or damages arising from this information and its display or use. Errors and omissions excepted.

The author and FXStreet are not registered investment advisors and nothing in this article is intended to be investment advice.

Recommended content


Recommended content

Editors’ Picks

EUR/USD holds above 1.0650 after US data

EUR/USD holds above 1.0650 after US data

EUR/USD retreats from session highs but manages to hold above 1.0650 in the early American session. Upbeat macroeconomic data releases from the US helps the US Dollar find a foothold and limits the pair's upside.

EUR/USD News

GBP/USD retreats toward 1.2450 on modest USD rebound

GBP/USD retreats toward 1.2450 on modest USD rebound

GBP/USD edges lower in the second half of the day and trades at around 1.2450. Better-than-expected Jobless Claims and Philadelphia Fed Manufacturing Index data from the US provides a support to the USD and forces the pair to stay on the back foot.

GBP/USD News

Gold is closely monitoring geopolitics

Gold is closely monitoring geopolitics

Gold trades in positive territory above $2,380 on Thursday. Although the benchmark 10-year US Treasury bond yield holds steady following upbeat US data, XAU/USD continues to stretch higher on growing fears over a deepening conflict in the Middle East.

Gold News

Ripple faces significant correction as former SEC litigator says lawsuit could make it to Supreme Court

Ripple faces significant correction as former SEC litigator says lawsuit could make it to Supreme Court

Ripple (XRP) price hovers below the key $0.50 level on Thursday after failing at another attempt to break and close above the resistance for the fourth day in a row. 

Read more

Have we seen the extent of the Fed rate repricing?

Have we seen the extent of the Fed rate repricing?

Markets have been mostly consolidating recent moves into Thursday. We’ve seen some profit taking on Dollar longs and renewed demand for US equities into the dip. Whether or not this holds up is a completely different story.

Read more

Forex MAJORS

Cryptocurrencies

Signatures