|

NZD/USD Price Analysis: Bulls stuck at 0.6000 as momentum lightens

  • Indicators on the daily chart shows decelerating bullish momentum.
  • The RSI on the hourly chart indicates fluctuating buying and selling pressures, despite its position in the positive zone.
  • For bulls to avoid losses, they must defend the key 20-day SMA.

The NZD/USD pair maintains a strong bearish bias despite recent upward movements as buyers seem to have stalled at around 0.6000 and struggle to gain further ground while momentum wanes.

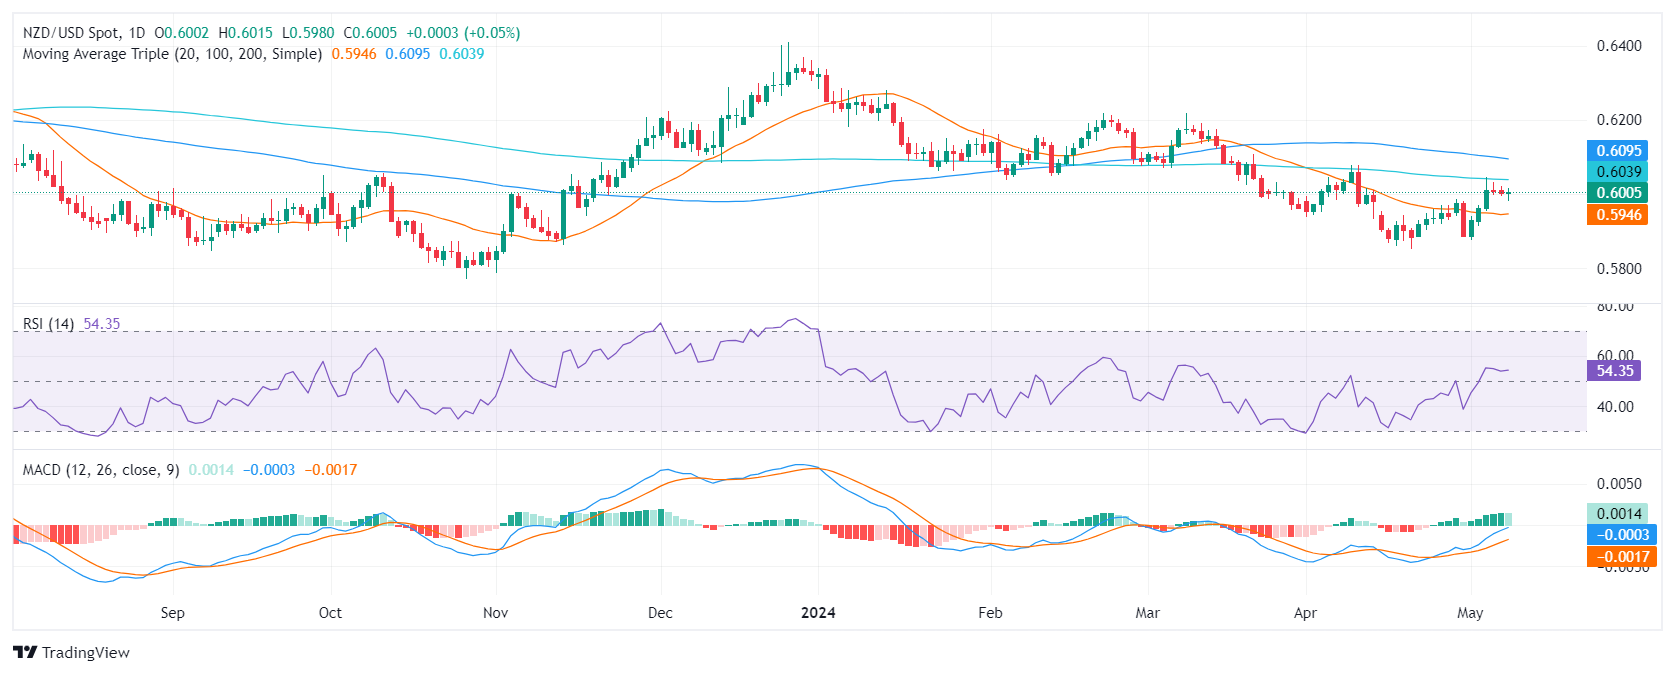
On the daily chart, technical indicators suggest a decelerating positive momentum for the pair while the prevailing downtrend persists. The Relative Strength Index (RSI) shows a positive trend after a slow ascend from the oversold region. However, the Moving Average Convergence Divergence (MACD) histogram reveals a transition towards diminishing green bars, indicating a decelerating bullish momentum.

NZD/USD daily chart

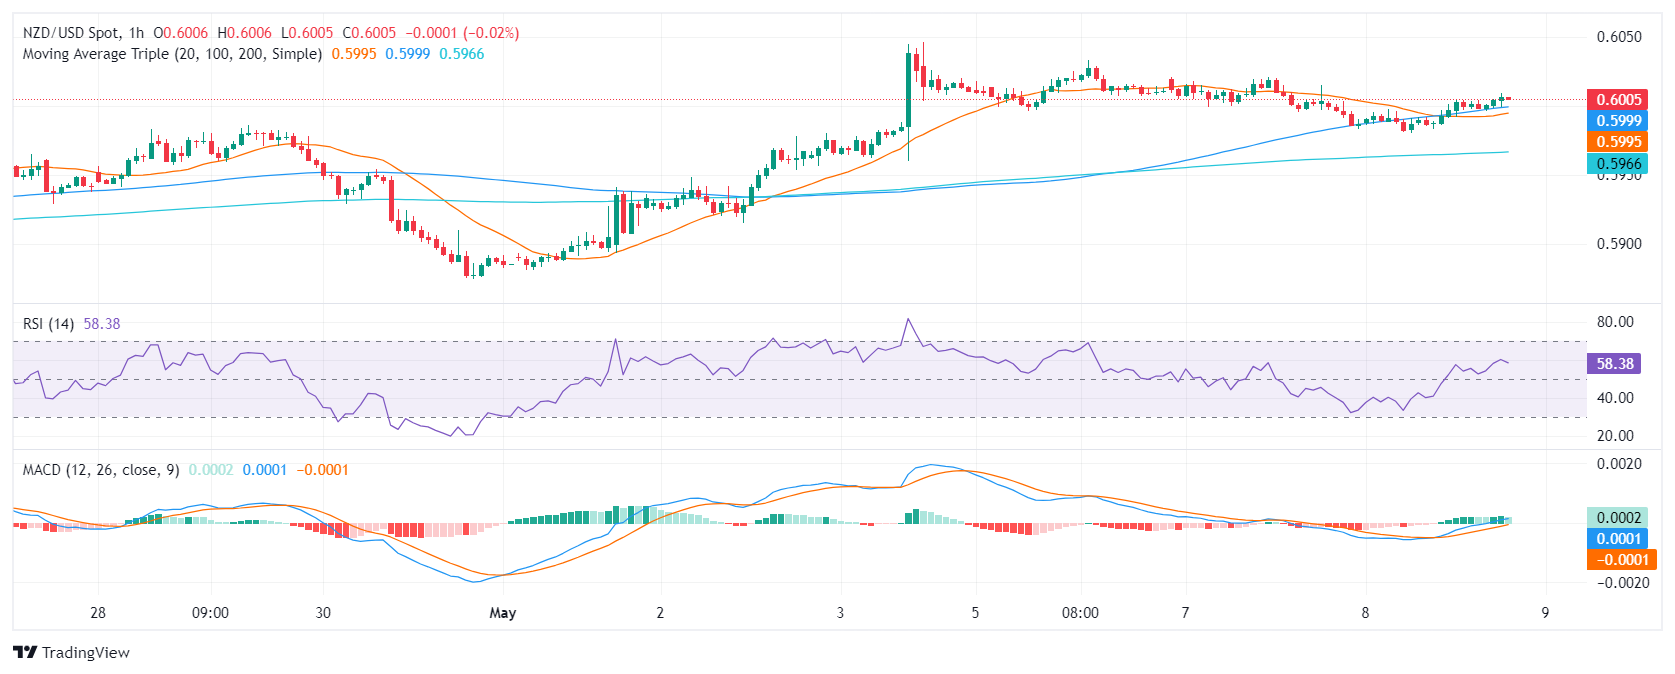
Contrastingly, the hourly RSI sits at 54. Although this is still in the positive territory, it is marginally edging lower. The past few hours have witnessed noticeable fluctuations, signaling varied buying and selling pressures. The hourly chart's MACD registers a decrease in green bars, implying receding positive momentum.

NZD/USD hourly chart

Broadening the perspective further reveals that the NZD/USD is caught in a downtrend as it lies beneath the 100 and 200-day Simple Moving Averages (SMA). That being said, its position above the 20-day average still gives some light to the bulls as it hints at a short-term positive outlook. In summary, the technical indicators of the NZD/USD pair suggest a slowing positive momentum on both the daily and hourly charts, while the prevailing downtrend continues.

NZD/USD

Overview
Today last price0.6006
Today Daily Change0.0004
Today Daily Change %0.07
Today daily open0.6002
 
Trends
Daily SMA200.5945
Daily SMA500.6016
Daily SMA1000.6097
Daily SMA2000.6039
 
Levels
Previous Daily High0.6021
Previous Daily Low0.5995
Previous Weekly High0.6046
Previous Weekly Low0.5875
Previous Monthly High0.6079
Previous Monthly Low0.5851
Daily Fibonacci 38.2%0.6005
Daily Fibonacci 61.8%0.6011
Daily Pivot Point S10.5991
Daily Pivot Point S20.598
Daily Pivot Point S30.5965
Daily Pivot Point R10.6017
Daily Pivot Point R20.6032
Daily Pivot Point R30.6043

Author

Patricio Martín

Patricio is an economist from Argentina passionate about global finance and understanding the daily movements of the markets.

More from Patricio Martín
Share:

Editor's Picks

AUD/USD eyes 0.7150 barrier nine-day EMA

AUD/USD inches higher after registering modest losses in the previous day, trading around 0.7130 during the Asian hours. The technical analysis of the daily chart indicates that the pair is moving sideways within the rectangle pattern, suggesting a consolidation as neither the bulls nor the bears have enough momentum to take control of the market.

USD/JPY trades below 160.00 intervention threshold; bullish bias intact

The USD/JPY pair attracts some sellers during the Asian session amid fears that authorities will step in again to prop up the Japanese Yen. Furthermore, the Israel-Lebanon truce prompts some profit-taking around the US Dollar and exerts downward pressure on the currency pair.

Gold defends 200-day SMA at $4,425, but for how long?

Gold is attempting a tepid recovery toward $4,500 early Thursday, as renewed optimism in the Mideast geopolitical front calms market nerves. This cautious optimism across Asian markets weighs on Oil prices, and diminishes the US Dollar’s safe-haven appeal, helping Gold stage a decent comeback from the weekly low of $4,424.


Hyperliquid: ETF demand, capital rotation fuel HYPE rally as Bitcoin melts

Hyperliquid price sustains an upward trend near its all-time high of $75.76 on Thursday after posting 80% gains in May, while Bitcoin (BTC) retraces below $65,000, triggering a market-wide panic.

Kevin Warsh takes the Fed helm: What it means for the US Dollar
The Federal Reserve moves away from the highly predictable "forward guidance" model of the Jerome Powell era to a new “Kevin Warsh environment”, characterized by less communication, more policy surprises, and an increased focus on the Fed's complex balance sheet.
Recession on paper: What really moves the Canadian Loonie now?

Statistics Canada handed the headline writers a gift and the analysts a headache. Real GDP shrank 0.1% on an annualized basis in the first quarter, and with the fourth quarter of 2025 revised down to a 1.0% contraction, that is two negative quarters in a row, the textbook definition of a technical recession and Canada's first since the pandemic.