|

NZD/USD Price Analysis: Bulls assert dominance, closes its best week of 2024

  • The daily chart reveals a strong bullish sentiment with indicators deep in positive territory.
  • Hourly indicators show a flattening buying traction but remain positive.
  • The pair closed its best week since November 2023.

In Friday's session, the NZD/USD rose to the 0.6137 level, demonstrating a strong bullish trend. After closing above its main Simple Moving Averages (SMAs) of 20,100 and 200 days, the pair secured its best week since late 2023.

On the daily chart, the Relative Strength Index (RSI) reveals a positive trend, moving from below 60 and nearing the 70 mark. This indicates that the NZD/USD pair is accumulating strength, demonstrating bullish pressure in the recent sessions. Concurrently, the Moving Average Convergence Divergence (MACD) prints green bars, showing steady buying traction.

NZD/USD daily chart

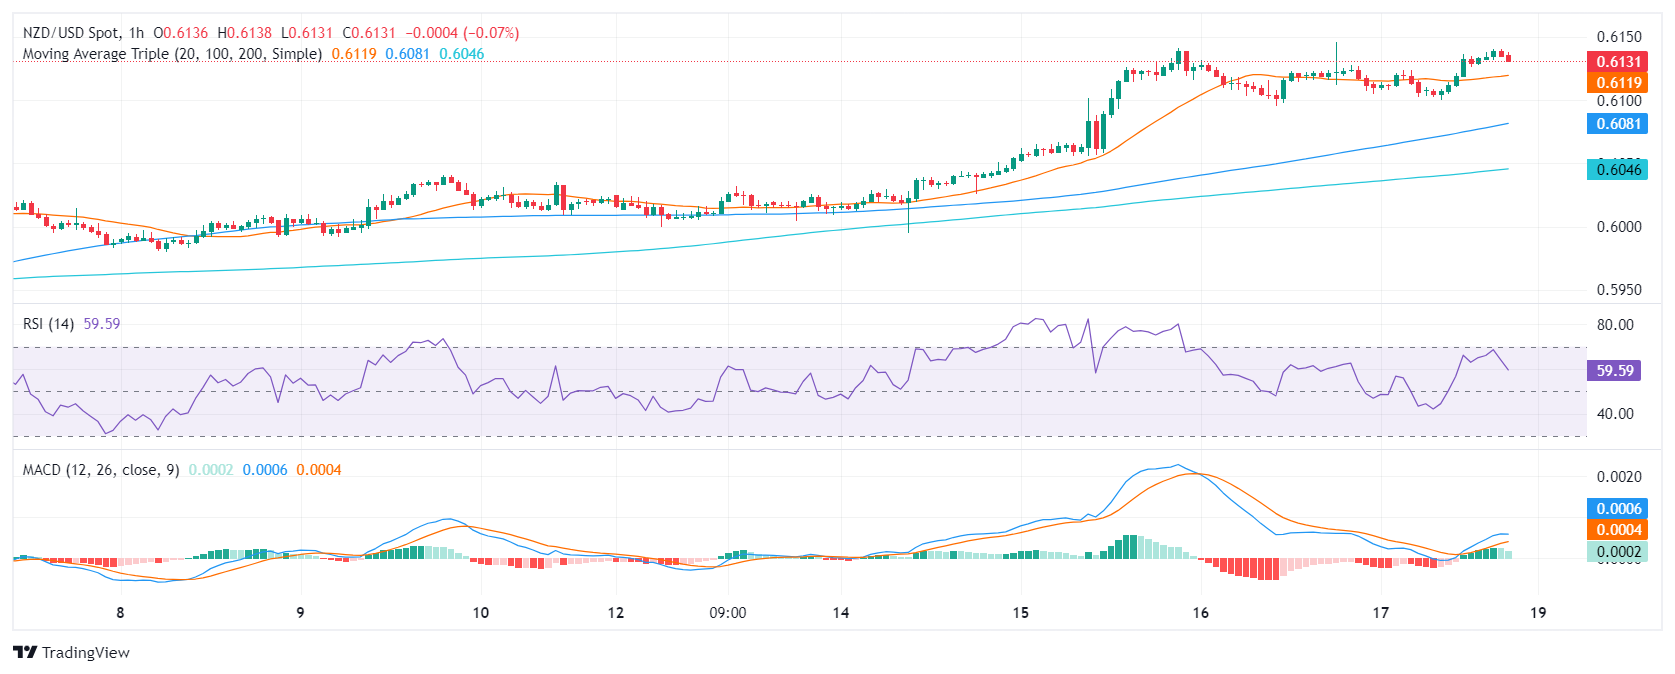
The hourly RSI readings exhibit a consistent positive trend over the recent hours, but was seen finishing at 57.17 but pointing downwards. The hourly MACD chart supports this view, with gradually diminishing green bars indicating a slowing positive momentum as investors take profits.

NZD/USD hourly chart

In conclusion, the NZD/USD is in a robust technical position, showing short and long-term bullish signals on the daily and short-term charts. Although the RSI shows that the pair is approaching overbought conditions and the  hourly indicators show dwindling positive momentum, the pair retains its position above vital SMAs. Traders shouldn’t take off the table further corrective movements as investors might continue taking profits.

NZD/USD

Overview
Today last price0.6131
Today Daily Change0.0010
Today Daily Change %0.16
Today daily open0.6121
 
Trends
Daily SMA200.5985
Daily SMA500.6008
Daily SMA1000.6079
Daily SMA2000.6039
 
Levels
Previous Daily High0.6141
Previous Daily Low0.6095
Previous Weekly High0.6041
Previous Weekly Low0.598
Previous Monthly High0.6079
Previous Monthly Low0.5851
Daily Fibonacci 38.2%0.6113
Daily Fibonacci 61.8%0.6123
Daily Pivot Point S10.6097
Daily Pivot Point S20.6073
Daily Pivot Point S30.6051
Daily Pivot Point R10.6143
Daily Pivot Point R20.6165
Daily Pivot Point R30.6189

Author

Patricio Martín

Patricio is an economist from Argentina passionate about global finance and understanding the daily movements of the markets.

More from Patricio Martín
Share:

Markets move fast. We move first.

Orange Juice Newsletter brings you expert driven insights - not headlines. Every day on your inbox.

By subscribing you agree to our Terms and conditions.

Editor's Picks

EUR/USD: Bulls pray for a dovish Fed

EUR/USD has finally taken a breather after a pretty energetic climb. The pair broke above 1.1680 in the second half of the week, reaching its highest levels in around two months before running into some selling pressure. Even so, it has gained almost two cents from the late-November dip just below 1.1500 the figure.

GBP/USD trims gains, recedes toward 1.3320

GBP/USD is struggling to keep its daily advance, coming under fresh pressure and retreating to the 1.3320 zone following a mild bullish attempt in the Greenback. Even though US consumer sentiment surprised to the upside, the US Dollar isn’t getting much love, as traders are far more interested in what the Fed will say next week.

Gold: Bullish momentum fades despite broad USD weakness

After rising more than 3.5% in the previous week, Gold has entered a consolidation phase and fluctuated at around $4,200. The Federal Reserve’s interest rate decision and revised Summary of Economic Projections, also known as the dot plot, could trigger the next directional move in XAU/USD. 

Week ahead: Rate cut or market shock? The Fed decides

Fed rate cut widely expected; dot plot and overall meeting rhetoric also matter. Risk appetite is supported by Fed rate cut expectations; cryptos show signs of life. RBA, BoC and SNB also meet; chances of surprises are relatively low. Dollar weakness could linger; both the aussie and the yen best positioned to gain further. Gold and oil eye Ukraine-Russia developments; a peace deal remains elusive.

The Silver disconnection is real

Silver just hit a new all-time high. Neither did gold, nor mining stocks. They all reversed on an intraday basis, but silver’s move to new highs makes it still bullish overall, while the almost complete reversals in gold and miners make the latter technically bearish.

Ripple faces persistent bear risks, shrugging off ETF inflows

Ripple is extending its decline for the second consecutive day, trading at $2.06 at the time of writing on Friday. Sentiment surrounding the cross-border remittance token continues to lag despite steady inflows into XRP spot ETFs.