|

NZD/USD Price Analysis: Bears maintain control, signs of short-term recovery surface

  • Indicators flash oversold conditions on the daily chart.
  • Contrarily, hourly chart indicators suggest a slow return of bullish impulse as the bears might have run out of steam.

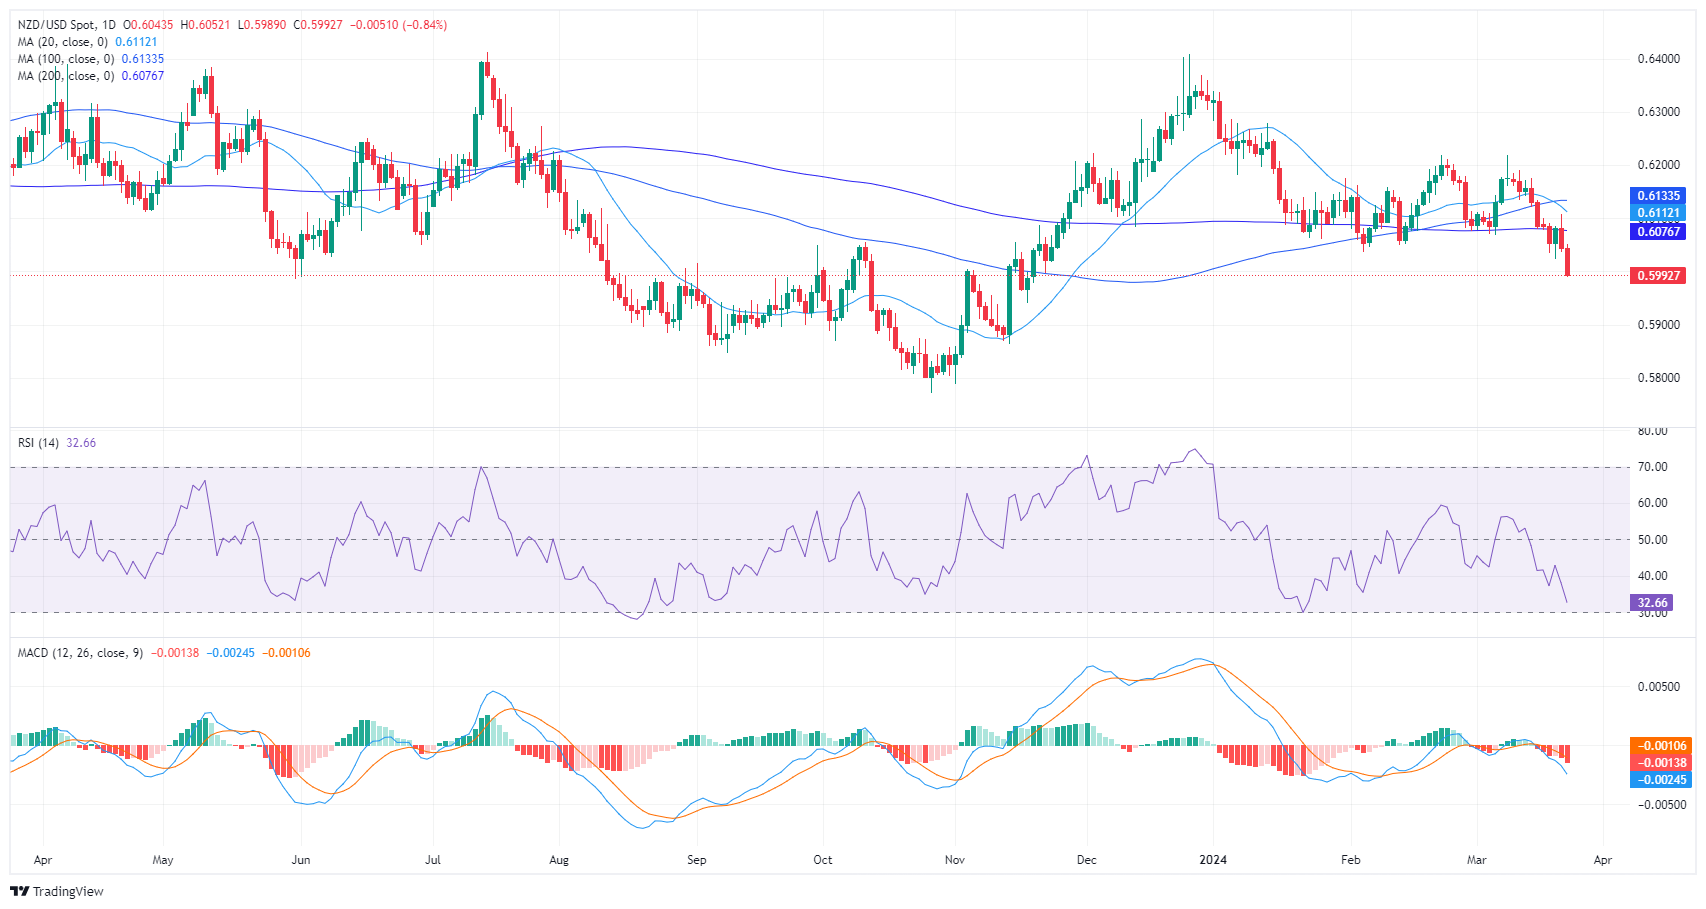
In Friday's session, the NZD/USD declined just below the 0.6000 threshold, illustrating a bearish outlook as sellers continue to dominate the market. The pair is positioned below its primary Simple Moving Averages (SMAs), further backing the bearish perspective. Technical indicators hint at a strengthening sellers' command but indicators lay in oversold terrain, a typical signal, and the buying momentum might recover.

On the daily chart, the Relative Strength Index (RSI) for the NZD/USD pair resides in negative territory presently, indicating a prevailing downtrend as sellers dominate the market. The RSI was reported at 33, bordering on oversold conditions, a potential indication for future corrective movement. The Moving Average Convergence Divergence (MACD) histogram exhibits rising red bars, also confirming the negative momentum.

NZD/USD daily chart

Moving to the hourly chart, the RSI levels convey a relatively similar scenario. The value last rested at 28, corroborating its presence in the oversold territory. Contrarily, the MACD on the hourly chart displays rising green bars, hinting at a creeping positive momentum.

NZD/USD hourly chart

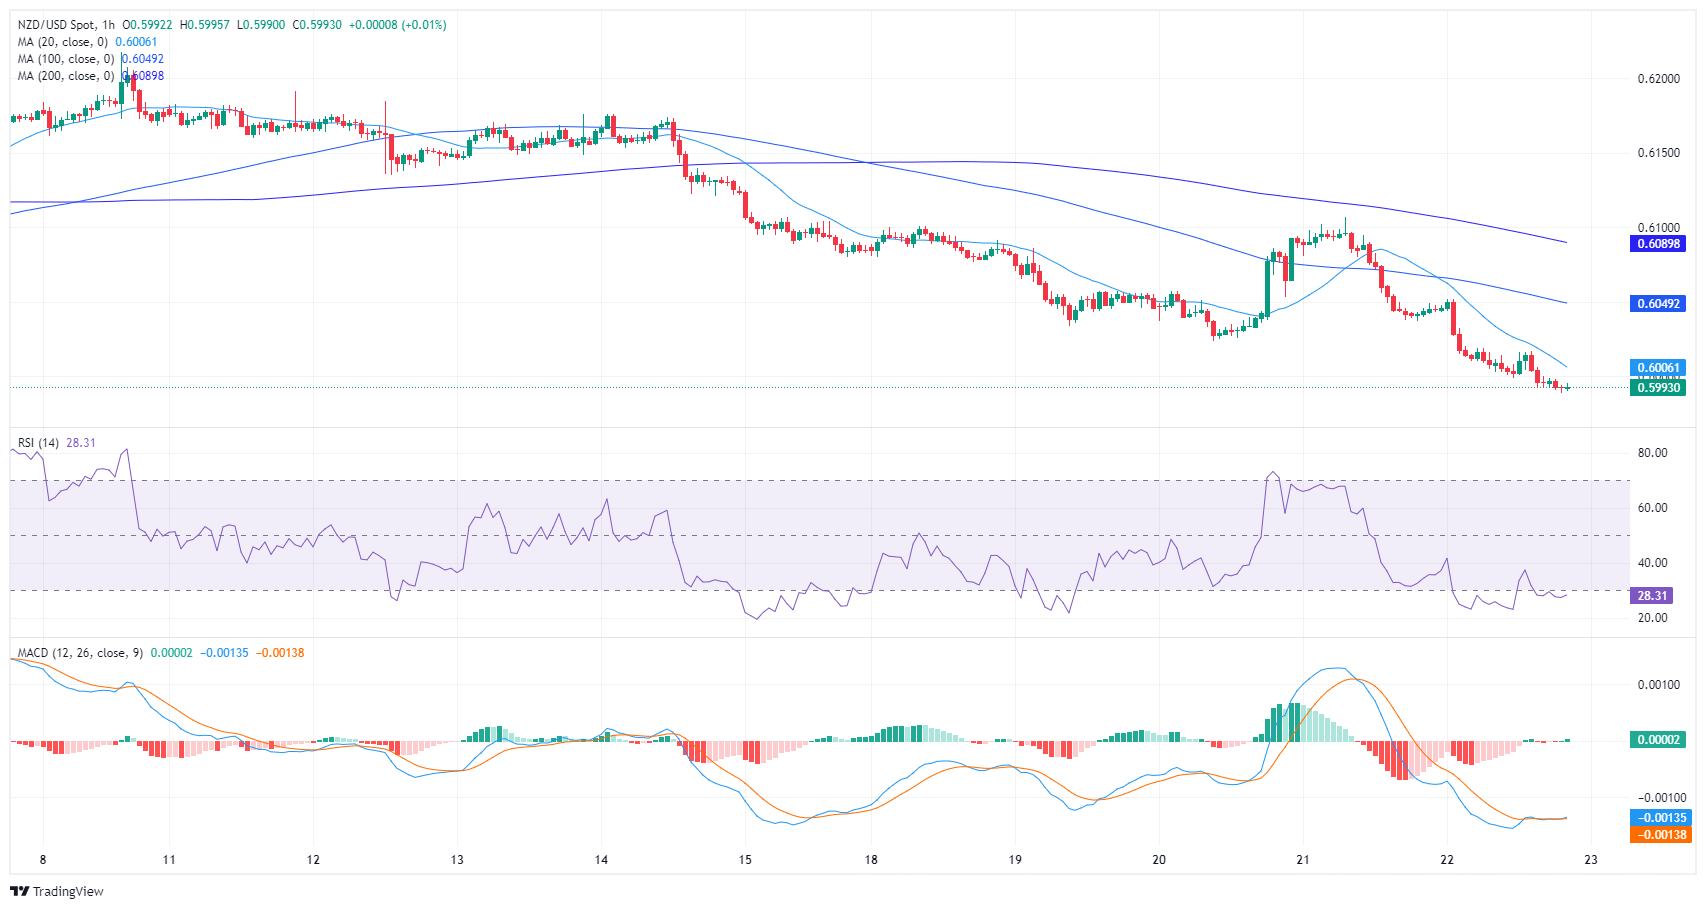
In essence, while the daily chart discloses a persisting bearish momentum, hourly indications of rising positive momentum in the MACD histogram may signal a reprieve from selling pressure. Looking at the broader trend, the pair is below the 20, 100, and 200-day Simple Moving Averages (SMAs), further implying a bearish outlook.

NZD/USD

Overview
Today last price0.5993
Today Daily Change-0.0051
Today Daily Change %-0.84
Today daily open0.6044
 
Trends
Daily SMA200.6122
Daily SMA500.6123
Daily SMA1000.6134
Daily SMA2000.6078
 
Levels
Previous Daily High0.6107
Previous Daily Low0.6037
Previous Weekly High0.6191
Previous Weekly Low0.608
Previous Monthly High0.6219
Previous Monthly Low0.6037
Daily Fibonacci 38.2%0.6064
Daily Fibonacci 61.8%0.608
Daily Pivot Point S10.6018
Daily Pivot Point S20.5993
Daily Pivot Point S30.5948
Daily Pivot Point R10.6088
Daily Pivot Point R20.6133
Daily Pivot Point R30.6158

Author

Patricio Martín

Patricio is an economist from Argentina passionate about global finance and understanding the daily movements of the markets.

More from Patricio Martín
Share:

Markets move fast. We move first.

Orange Juice Newsletter brings you expert driven insights - not headlines. Every day on your inbox.

By subscribing you agree to our Terms and conditions.

Editor's Picks

EUR/USD moves sideways below 1.1800 on Christmas Eve

EUR/USD struggles to find direction and trades in a narrow channel below 1.1800 after posting gains for two consecutive days. Bond and stock markets in the US will open at the usual time and close early on Christmas Eve, allowing the trading action to remain subdued. 

GBP/USD keeps range around 1.3500 amid quiet markets

GBP/USD keeps its range trade intact at around 1.3500 on Wednesday. The Pound Sterling holds the upper hand over the US Dollar amid pre-Christmas light trading as traders move to the sidelines heading into the holiday season. 

Gold retreats from record highs, trades below $4,500

Gold retreats after setting a new record-high above $4,520 earlier in the day and trades in a tight range below $4,500 as trading volumes thin out ahead of the Christmas break. The US Dollar selling bias remains unabated on the back of dovish Fed expectations, which continues to act as a tailwind for the bullion amid persistent geopolitical risks.

Bitcoin slips below $87,000 as ETF outflows intensify, whale participation declines

Bitcoin price continues to trade around $86,770 on Wednesday, after failing to break above the $90,000 resistance. US-listed spot ETFs record an outflow of $188.64 million on Tuesday, marking the fourth consecutive day of withdrawals.

Economic outlook 2026-2027 in advanced countries: Solidity test

After a year marked by global economic resilience and ending on a note of optimism, 2026 looks promising and could be a year of solid economic performance. In our baseline scenario, we expect most of the supportive factors at work in 2025 to continue to play a role in 2026.

Avalanche struggles near $12 as Grayscale files updated form for ETF

Avalanche trades close to $12 by press time on Wednesday, extending the nearly 2% drop from the previous day. Grayscale filed an updated form to convert its Avalanche-focused Trust into an ETF with the US Securities and Exchange Commission.