|

NZD/USD Price Analysis: Bearish overtones persist, bullish hints emerge on the horizon

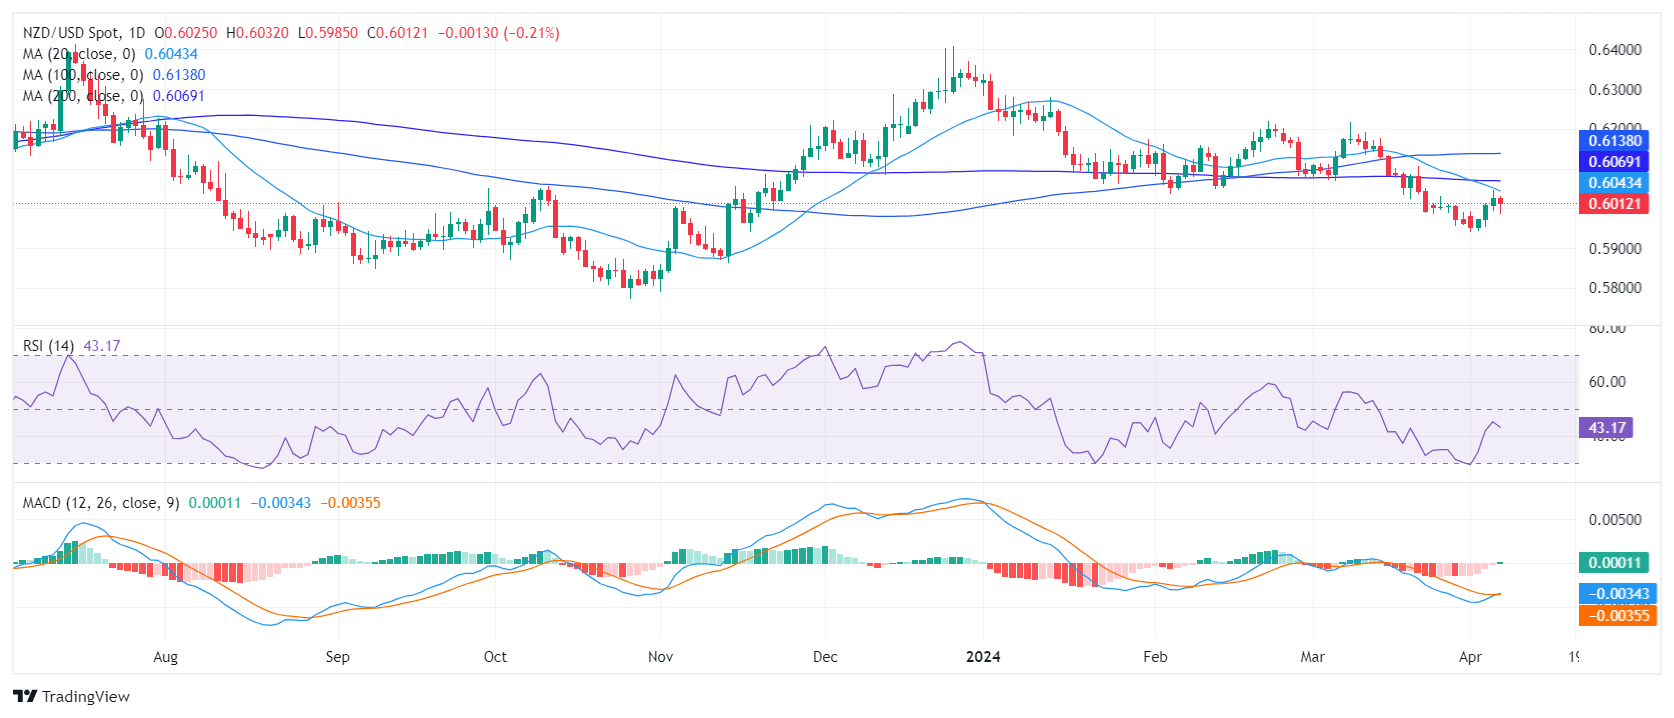
  • The daily MACD shows a slight positive momentum, despite the overall bearish bias.
  • The daily RSI indicates that the sellers are dominating, though the indicator's flat trajectory suggests that the bearish momentum may be slowing.
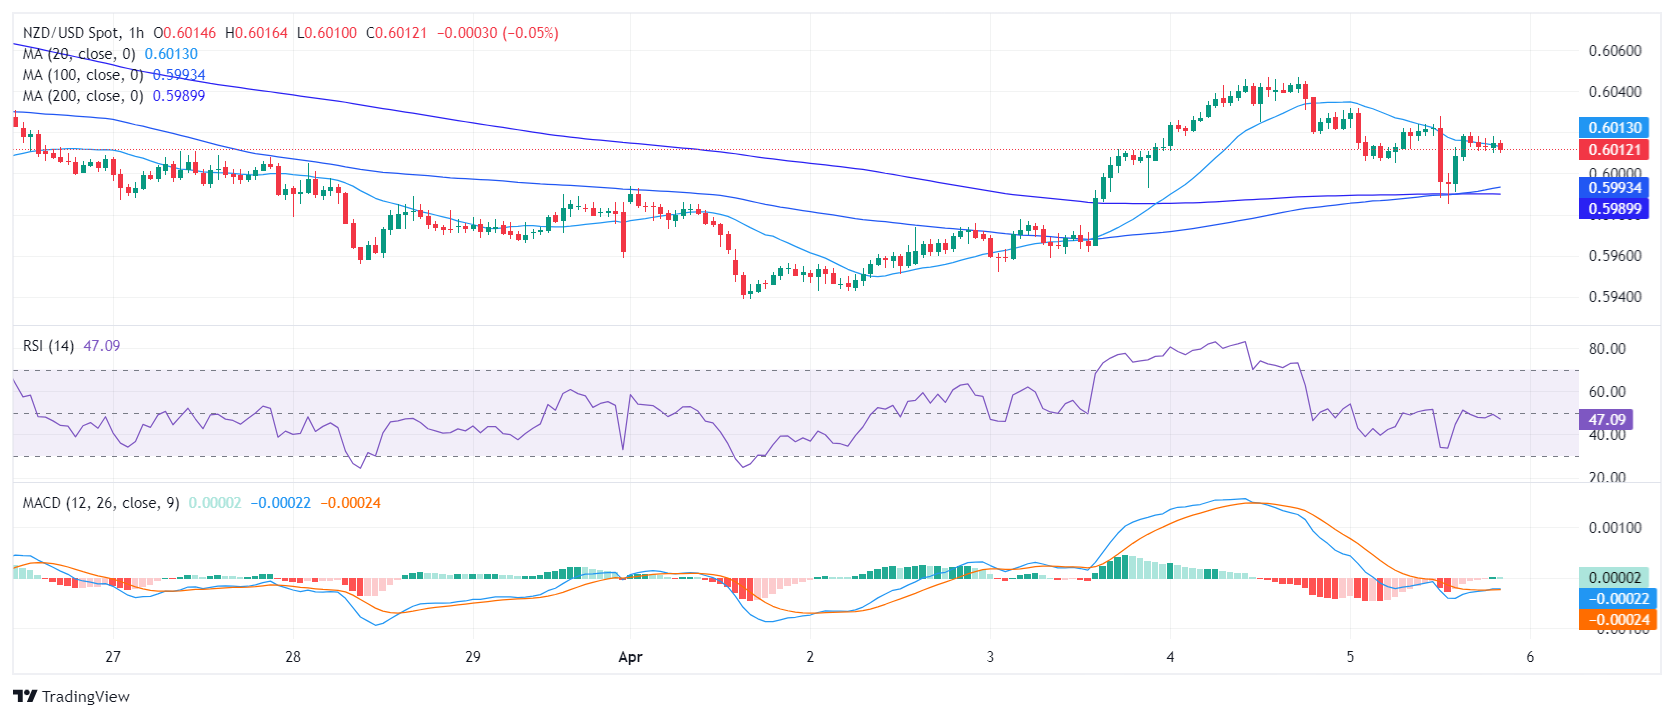
  • On the hourly chart, the RSI oscillated near the neutral zone, showing inconsistent bearish-bullish signals.

The NZD/USD pair is trading at 0.6013, indicating a drop of 0.26% in Friday's session but will close a winning week. The prolonged downward trend suggests that sellers command the current market. However, the short-term outlook reveals a slight bullish momentum, which could lead to a period of sideways trading in the next sessions.

The daily Relative Strength Index (RSI) resides in negative territory, with a slightly flat slope, indicating sellers dominate this market but seem to be taking a breather. Moreover, the Moving Average Convergence Divergence (MACD) histogram has registered a green bar, pointing to a slight emergence of positive momentum.

NZD/USD daily chart

On the hourly chart, the most recent RSI reading of 47 hovers close to the neutral zone while the MACD histogram draws flat green bars, which can be interpreted as somewhat positive short-term momentum.

NZD/USD hourly chart

Regarding the overall trend, the NZD/USD remains under the 20,100 and 200-day SMA indicating that the overall trend favors the bears. So in case the buyers manage to gain ground, any movement below these levels wouldn’t be considered a serious buying signal.

NZD/USD

Overview
Today last price0.6012
Today Daily Change-0.0013
Today Daily Change %-0.22
Today daily open0.6025
 
Trends
Daily SMA200.6052
Daily SMA500.6095
Daily SMA1000.6138
Daily SMA2000.607
 
Levels
Previous Daily High0.6047
Previous Daily Low0.5993
Previous Weekly High0.6032
Previous Weekly Low0.5956
Previous Monthly High0.6218
Previous Monthly Low0.5956
Daily Fibonacci 38.2%0.6026
Daily Fibonacci 61.8%0.6014
Daily Pivot Point S10.5996
Daily Pivot Point S20.5968
Daily Pivot Point S30.5942
Daily Pivot Point R10.605
Daily Pivot Point R20.6076
Daily Pivot Point R30.6104

Author

Patricio Martín

Patricio is an economist from Argentina passionate about global finance and understanding the daily movements of the markets.

More from Patricio Martín
Share:

Markets move fast. We move first.

Orange Juice Newsletter brings you expert driven insights - not headlines. Every day on your inbox.

By subscribing you agree to our Terms and conditions.

Editor's Picks

EUR/USD: Bulls pray for a dovish Fed

EUR/USD has finally taken a breather after a pretty energetic climb. The pair broke above 1.1680 in the second half of the week, reaching its highest levels in around two months before running into some selling pressure. Even so, it has gained almost two cents from the late-November dip just below 1.1500 the figure.

GBP/USD trims gains, recedes toward 1.3320

GBP/USD is struggling to keep its daily advance, coming under fresh pressure and retreating to the 1.3320 zone following a mild bullish attempt in the Greenback. Even though US consumer sentiment surprised to the upside, the US Dollar isn’t getting much love, as traders are far more interested in what the Fed will say next week.

Gold: Bullish momentum fades despite broad USD weakness

After rising more than 3.5% in the previous week, Gold has entered a consolidation phase and fluctuated at around $4,200. The Federal Reserve’s interest rate decision and revised Summary of Economic Projections, also known as the dot plot, could trigger the next directional move in XAU/USD. 

Week ahead: Rate cut or market shock? The Fed decides

Fed rate cut widely expected; dot plot and overall meeting rhetoric also matter. Risk appetite is supported by Fed rate cut expectations; cryptos show signs of life. RBA, BoC and SNB also meet; chances of surprises are relatively low. Dollar weakness could linger; both the aussie and the yen best positioned to gain further. Gold and oil eye Ukraine-Russia developments; a peace deal remains elusive.

Week ahead – Rate cut or market shock? The Fed decides

Fed rate cut widely expected; dot plot and overall meeting rhetoric also matter. Risk appetite is supported by Fed rate cut expectations; cryptos show signs of life. RBA, BoC and SNB also meet; chances of surprises are relatively low.

Ripple faces persistent bear risks, shrugging off ETF inflows

Ripple is extending its decline for the second consecutive day, trading at $2.06 at the time of writing on Friday. Sentiment surrounding the cross-border remittance token continues to lag despite steady inflows into XRP spot ETFs.