NZD/USD plunges more than 1%, hits 6-week low on improved US business activity
- US Dollar benefits from upbeat Manufacturing and Services PMIs for April.
- Fed’s Harker signals the end of rate hikes, but Mester suggests higher rates are needed.
- NZD/USD Price Analysis: Bearish biased and can test YTD lows if it dives below 0.6084.

The NZD/USD fell to six-week lows around 0.6126 as business activity in the United States (US) improved, triggering flows toward the American Dollar (USD). Therefore, the New Zealand Dollar (NZD) weakened, also undermined by lower inflation, as reported during the week. At the time of writing, the NZD/USD is trading at 0.6140, down more than 1%.
USD gains on positive PMIs, mixed signals from Fed officials; NZD/USD at risk of testing YTD lows
US equities fluctuated between gains and losses after S&P Global revealed an expansion in the US economy, bolstering the US Dollar (USD). S&P Global Manufacturing and Services PMIs for April exceed estimates above the 50 level, which usually delineates expansion/contraction in the economy. Therefore, the Composite PMI edged higher, at 53.5, above the prior reading of 52.3.
Federal Reserve officials hawkish rhetoric weighed in the NZD/USD for the third time in the week. Although the Philadelphia Fed President Patrick Harker signaled that the Fed is about to finish hiking rates, his colleague Cleveland’s Fed President Loretta Mester noted that rates should go above 5%, due to high inflationary pressures.
Given the lack of economic data from New Zealand, which reported inflation and was lower than the Reserve Bank of New Zealand (RBNZ) estimates of 1.8% QoQ, at 1.2%, could spark a pause on the RBNZ tightening cycle. The RBNZ delivered a hawkish 50 bps hike at its latest meeting.
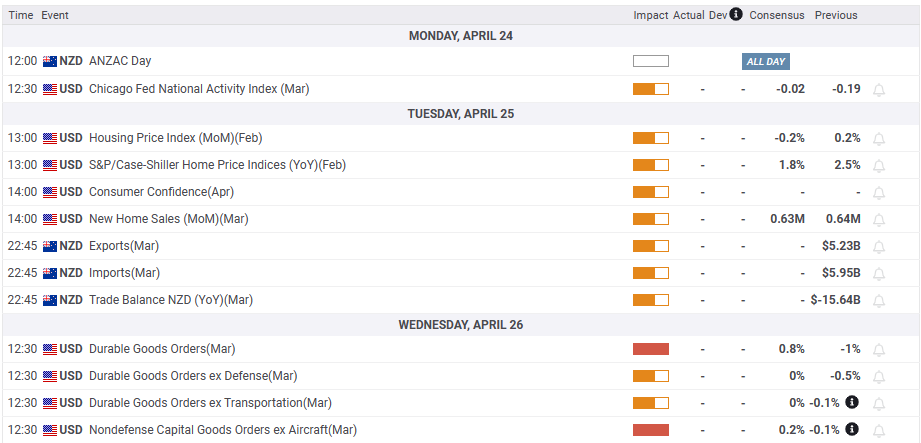
Ahead of the week, the US economic docket will feature Fed Governor Lisa Cook as traders prepare for the weekend.
NZD/USD Technical Analysis
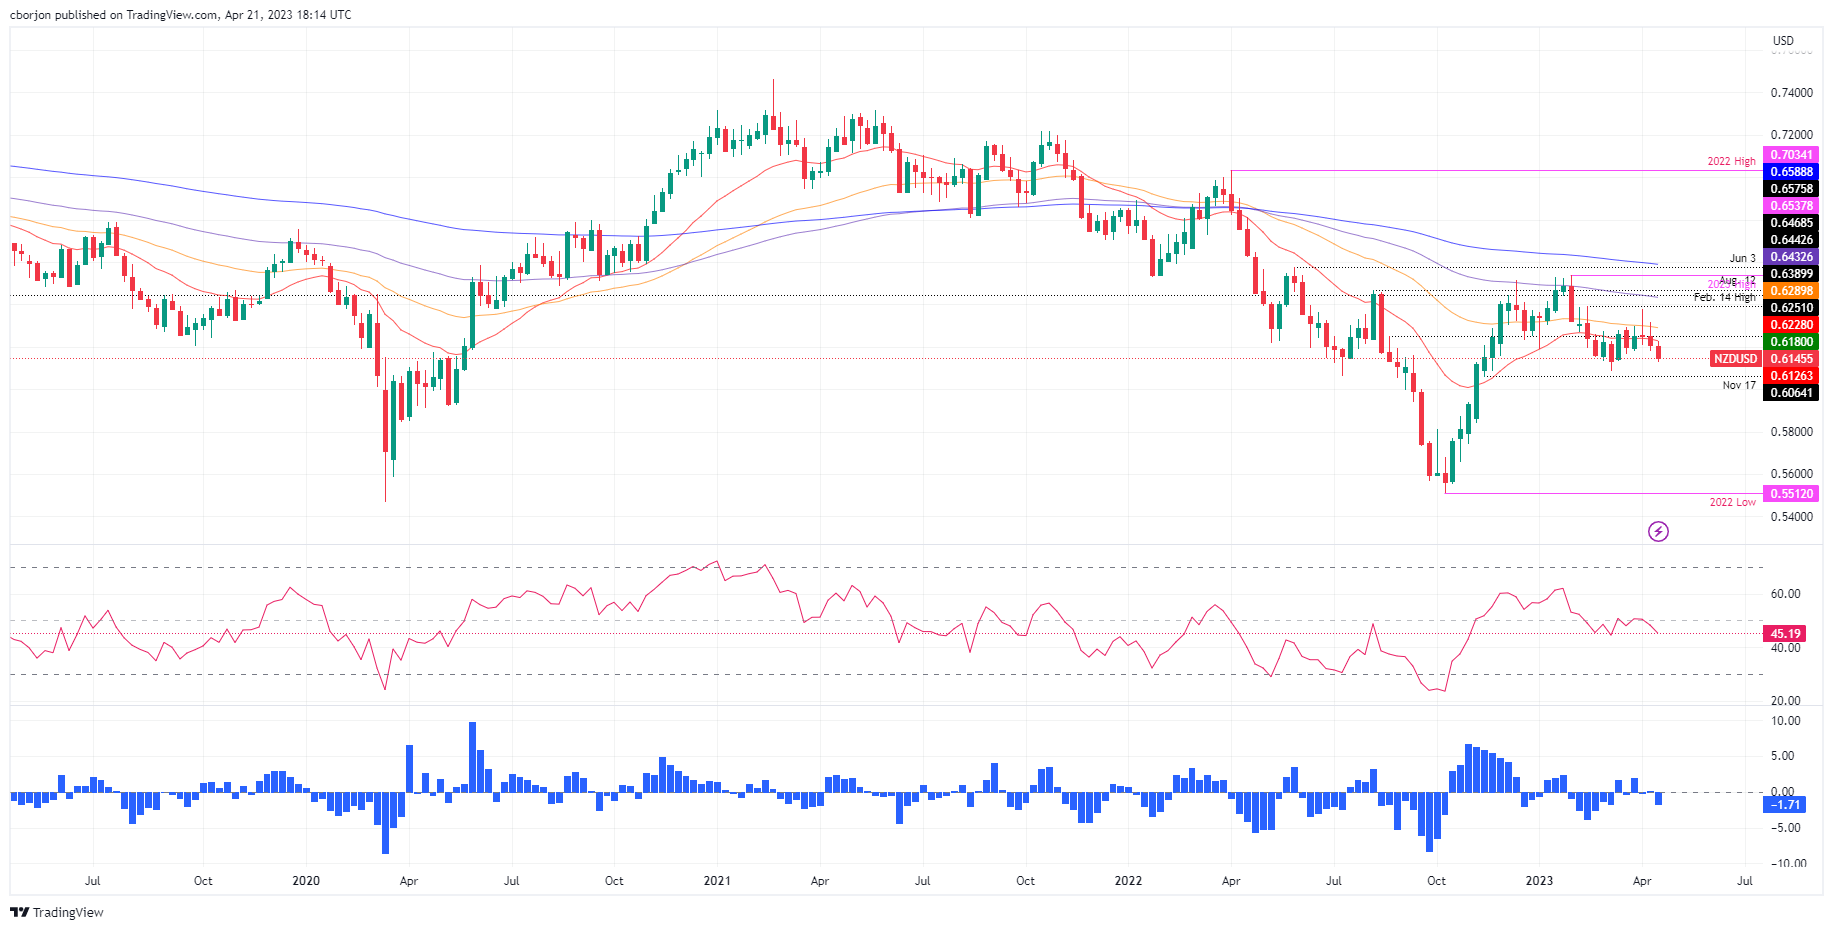
After hitting a weekly high of 0.6379, the NZD/USD formed an inverted hammer in the daily chart, suggesting that the major could be headed down. Indeed, the NZD/USD dropped below the 50 and 20-day Exponential Moving Averages (EMAs), each at 0.6289 and 0.6227, respectively. The Relative Strength Index (RSI) turned bearish while the Rate of Change (RoC) indicated that sellers were gathering momentum. Hence, the NZD/USD path of least resistance is downwards. The first support would be the 0.6100 figure, followed by March’s low of 0.6084, before testing the YTD low at 0.5912.
What to watch?
Author

Christian Borjon Valencia
FXStreet
Markets analyst, news editor, and trading instructor with over 14 years of experience across FX, commodities, US equity indices, and global macro markets.


