NZD/USD looking to stabilize near 0.5950 ahead of US data heavy week
- The NZD/USD is drifting around 0.5950 for Tuesday after recovering from a knockback to 0.5935.
- The economic calendar is notably Kiwi-light this week.
- US GDP and PCE inflation figures to dominate headlines through the mid-week.

The NZD/USD is trading back and forth for Tuesday, capped by the 0.5970 level as markets spread their Kiwi (NZD) bets ahead of a US data-heavy calendar for the back half of the trading week.
The Kiwi hit an intraday high just shy of 0.5975 in the early Tuesday trading session before slumping to a low of 0.5935. The pair has since recovered to somewhere near the middle as traders wait for a reason to find some momentum.
The US Housing Price Index printed at 0.8%, a clear beat of the market-expected 0.5% and doubling the previous figure of 0.4%.
Despite the bumper housing price reading, housing data for the US came in mixed, capping off potential USD gains. New Home Sales for the month of August recorded an 8.7% decline, a significant backstep from the previous 4.4% gain.
Wednesday will see US Durable Goods Order for August, which are forecast to rebound from -5.2% -0.5%, an improvement but still in negative territory,
Greenback traders will be looking closely at US Gross Domestic Product (GDP) figures on Thursday, which is expected to hold steady at an annualized 2.1% for the second quarter.
Thursday's GDP print will be followed by a speech by the Federal Reserve's (Fed) Chair Jerome Powell.
The trading week will close out with US Personal Consumption Expenditure (PCE) Price Index figures, the Fed's preferred measure of inflation.
The US PCE inflation reading for August is forecast to hold steady at 0.2%.
NZD/USD technical outlook
The NZD/USD is seeing mild consolidation on the hourly candles, and prices are cycling the 34-hour Exponential Moving Average (EMA) with technical support from the 200-hour Simple Moving Average (SMA) near 0.5935.
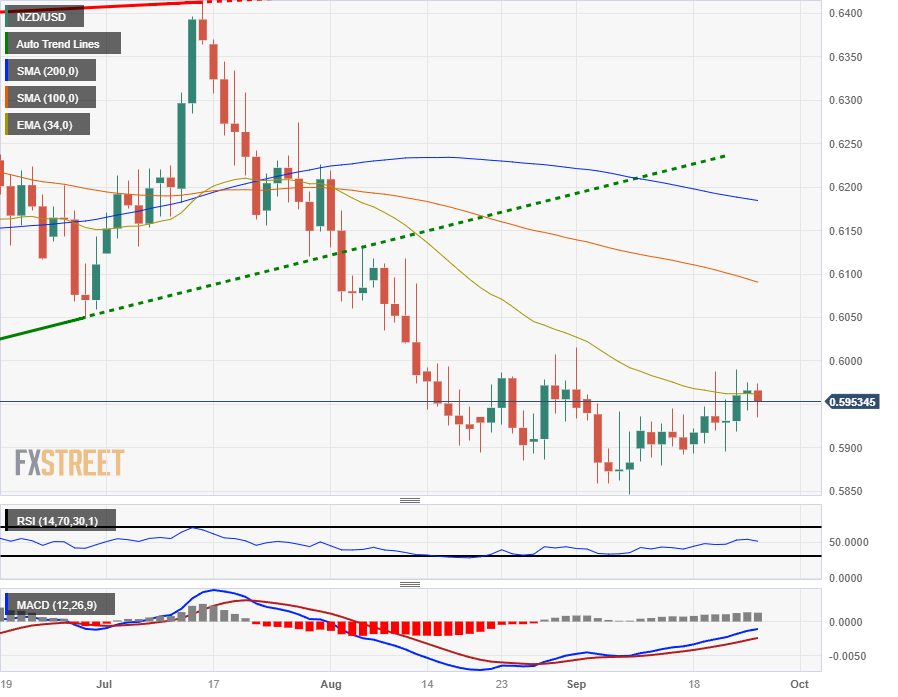
Daily candlesticks see the NZD/USD pinned to the 34-day EMA currently settling into 0.5960, and a significant break higher will run into the 100- and 200-day SMAs, near 0.6080 and 0.6180 respectively.
Despite finding a technical floor from early September's swing low into 0.5850, the NZD/USD remains notably bearish, down -7.2% from July's peak near 0.6415. Technical indicators are beginning to spread to the middle as directional momentum bleeds out of the pair, and the Relative Strength Index (RSI) is stuck in no man's land near the 50.0 level.
NZD/USD daily chart
NZD/USD technical level
Author

Joshua Gibson
FXStreet
Joshua joins the FXStreet team as an Economics and Finance double major from Vancouver Island University with twelve years' experience as an independent trader focusing on technical analysis.
















