|

NZD/USD Forecast: Wall Street weighs on commodity-linked currencies

  • Investors kept their eyes on government bond yields and stocks for direction.
  • Reserve Bank of Australia Governor Michele Bullock will hit the wires early on Friday.
  • NZD/USD could accelerate its slump on a break through 0.6078.

The NZD/USD pair trades just below the 0.6100 mark ahead of the Asian opening, ending Thursday with modest losses. The pair hit 0.6123 at the beginning of the day, but quickly turned south as the US Dollar found legs on strong American data and the soft tone of stock markets.  It is worth adding, however, that after spending most of the day in the red, Wall Street has managed to trim early losses, with the Dow Jones Industrial Average and the Nasdaq Composite posting modest gains and the S&P500 poised to end the day little changed just below the 5,000 mark.

Focus on equities and yields

The focus was not only on equities. Investors were also paying attention to US Treasury yields, up on the day on the back of signs the Federal Reserve (Fed) has no reason to rush into cutting interest rates. Multiple policymakers hit the wires these days and backed Chairman Jerome Powell’s concepts, expressed in the aftermath of the latest monetary policy. The main idea is that interest rates will remain at current levels until officials are more certain inflation will stabilize around their 2% goal.

In the meantime, solid US employment-related data took out pressure from policymakers. The country reported that weekly unemployment claims rose to 218K in the week finished February 2, beating the 220K expected.

The macroeconomic calendar will remain scarce in Asia on Friday, with only a speech from the Reserve Bank of Australia (RBA) Governor Michele Bullock in the docket.

NZD/USD Technical Outlook

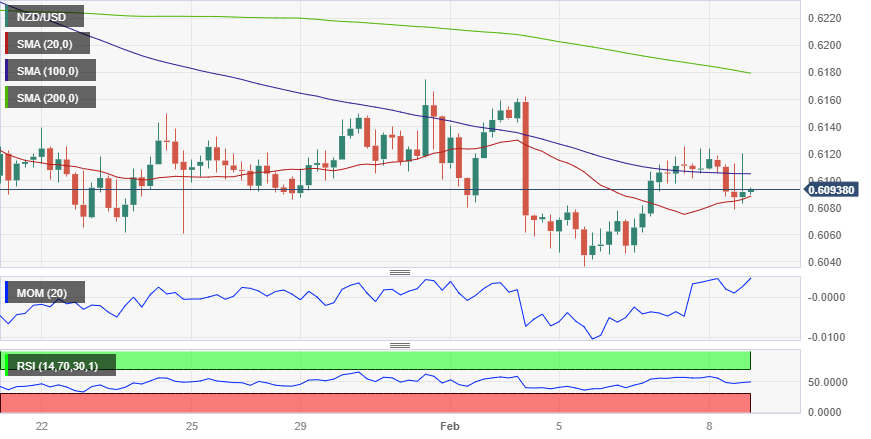
The NZD/USD pair held within familiar levels, maintaining a technically neutral stance. The daily chart shows sellers are aligned around a bearish 20 Simple Moving Average (SMA), while intraday buying interest surged around a flat 200 SMA, the latter at around 0.6080.

The same chart shows technical indicators have lost momentum within negative levels, lacking enough directional strength to anticipate a new leg south.

The case for another leg lower should be stronger on a break through the daily low, at 0.6078. Speculative interest will then look to test buyers´ determination at 0.6028, the February monthly low.

NZD/USD

Overview
Today last price0.6094
Today Daily Change-0.0015
Today Daily Change %-0.25
Today daily open0.6109
 
Trends
Daily SMA200.6123
Daily SMA500.6187
Daily SMA1000.6067
Daily SMA2000.6085
 
Levels
Previous Daily High0.6125
Previous Daily Low0.6073
Previous Weekly High0.6175
Previous Weekly Low0.6059
Previous Monthly High0.6339
Previous Monthly Low0.6061
Daily Fibonacci 38.2%0.6105
Daily Fibonacci 61.8%0.6093
Daily Pivot Point S10.608
Daily Pivot Point S20.6051
Daily Pivot Point S30.6028
Daily Pivot Point R10.6132
Daily Pivot Point R20.6154
Daily Pivot Point R30.6183

Author

FXStreet Team

Composed of a group of economic journalists and FX experts, the FXStreet content team produces and oversees all content published on FXStreet. It provides a purely journalistic approach to the Forex market.

More from FXStreet Team
Share:

Editor's Picks

AUD/USD eyes 0.7150 barrier nine-day EMA

AUD/USD inches higher after registering modest losses in the previous day, trading around 0.7130 during the Asian hours. The technical analysis of the daily chart indicates that the pair is moving sideways within the rectangle pattern, suggesting a consolidation as neither the bulls nor the bears have enough momentum to take control of the market.

USD/JPY trades below 160.00 intervention threshold; bullish bias intact

The USD/JPY pair attracts some sellers during the Asian session amid fears that authorities will step in again to prop up the Japanese Yen. Furthermore, the Israel-Lebanon truce prompts some profit-taking around the US Dollar and exerts downward pressure on the currency pair.

Gold defends 200-day SMA at $4,425, but for how long?

Gold is attempting a tepid recovery toward $4,500 early Thursday, as renewed optimism in the Mideast geopolitical front calms market nerves. This cautious optimism across Asian markets weighs on Oil prices, and diminishes the US Dollar’s safe-haven appeal, helping Gold stage a decent comeback from the weekly low of $4,424.


Hyperliquid: ETF demand, capital rotation fuel HYPE rally as Bitcoin melts

Hyperliquid price sustains an upward trend near its all-time high of $75.76 on Thursday after posting 80% gains in May, while Bitcoin (BTC) retraces below $65,000, triggering a market-wide panic.

Kevin Warsh takes the Fed helm: What it means for the US Dollar
The Federal Reserve moves away from the highly predictable "forward guidance" model of the Jerome Powell era to a new “Kevin Warsh environment”, characterized by less communication, more policy surprises, and an increased focus on the Fed's complex balance sheet.
Recession on paper: What really moves the Canadian Loonie now?

Statistics Canada handed the headline writers a gift and the analysts a headache. Real GDP shrank 0.1% on an annualized basis in the first quarter, and with the fourth quarter of 2025 revised down to a 1.0% contraction, that is two negative quarters in a row, the textbook definition of a technical recession and Canada's first since the pandemic.