NZD/USD bounces for Monday, eyes on 0.6000
- The NZD/USD rebounded in Monday action, ending the day just south of 0.5970 after falling to 0.5940.
- The US Dollar remains well-bid across the broader market.
- The economic calendar for this week is decidedly USD-heavy.

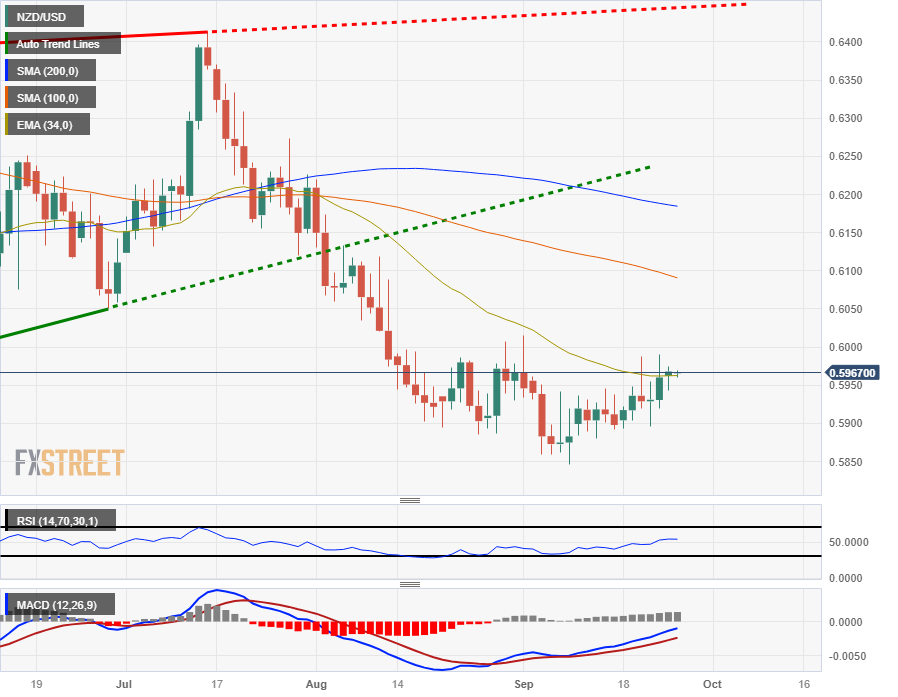
The NZD/USD is seeing some consolidation in the short term after slipping from the last swing high into 0.5985.
The Kiwi (NZD) has recovered 2% against the US Dollar (USD) from September's lows near 0.5850, but remains firmly bearish, down over 7% from July's peak near the 0.6400 handle.
With little data to drive the Kiwi on the economic calendar, market flows will be driven from the Greenback side.
Economic calendar sees all Greenback, little Kiwi for the week
Tuesday will bring US Housing Price Index growth for July, which is forecast to decline slightly from 0.3% to 0.1%. On Wednesday, US Durable Goods Orders for August are seen declining by 0.4%, but still an improvement on the previous month's -5.2%.
High-impact data kicks off on Thursday with US Gross Domestic Product (GDP) numbers for the second quarter; annualized quarter-on-quarter GDP growth is expected to improve slightly from 2.1% to 2.3%.
Improving GDP growth figures could see further gains for the US Dollar if the numbers manage to meet or beat forecasts.
Thursday will also be bringing a speech from Federal Reserve (Fed) Chair Jerome Powell, followed by New Zealand's only representation on the economic calendar this week with mid-tier consumer confidence figures.
The ANZ Roy Morgan Consumer Confidence survey index for September will be landing at 21:00 GMT on Thursday. The indicator last printed at 85 back in August.
NZD/USD technical outlook
The Kiwi-Dollar pair is slowly recovering on daily candlesticks, and the NZD/USD is currently pinned to the 34-day Exponential Moving Average (EMA). Overall trend momentum remains decidedly bearish, with current price action trading well below the 200-day Simple Moving Average (SMA) crossing below 0.6200.
If bears manage to regain control of the NZD/USD, prices will be set to break into new lows for the year, and little technical support would remain until last's years lows near 0.5600.
NZD/USD daily chart
NZD/USD technical levels
Author

Joshua Gibson
FXStreet
Joshua joins the FXStreet team as an Economics and Finance double major from Vancouver Island University with twelve years' experience as an independent trader focusing on technical analysis.
















