NZD/JPY Price Forecast: Holds above 87.35 on risk-off mood, stays bullish
- NZD/JPY consolidates near 87.41 after strong Japan data and safe-haven flows lift Yen.
- Bullish structure holds as long as price stays above June 13 low of 85.84.
- Break above 88.00 targets 2025 high at 89.70; below 87.35 risks slide toward 87.00 and sub-86.00 Kumo top.

The NZD/JPY consolidates during the week, although it posted losses of over 0.44% on Tuesday, on solid Japanese economic data. Additionally, the risk-off mood, which has boosted safe-haven peers like the Yen, exerted downward pressure on the cross-pair, which trades at 87.41, virtually unchanged.
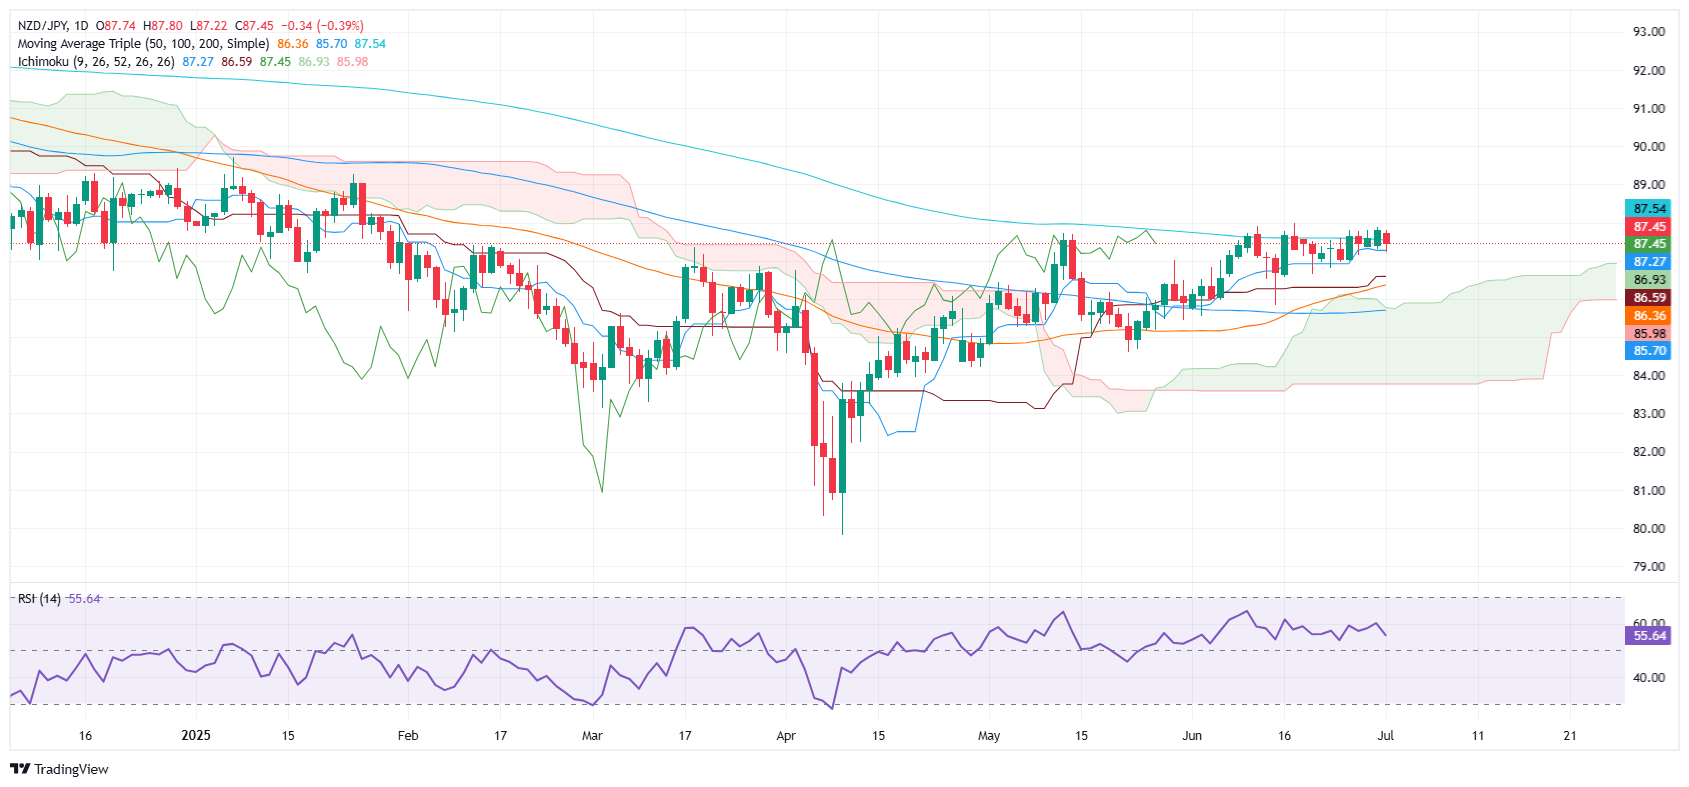
NZD/JPY Price Forecast: Technical outlook
Price action indicates that despite consolidating, the NZD/JPY is bullish biased. The pair cleared the Ichimoku Cloud (Kumo) since early May, while piercing the latest cycle high, which was witnessed on May 13 at 87.73.
Despite this, it is worth noting that the Relative Strength Index (RSI) is bullish but heading downwards. Hence, caution is warranted; however, if the NZD/JPY pair remains above the June 13 low of 85.84, market structure continues to respect the successive series of higher highs and higher lows.
If NZD/JPY clears the 88.00 figure, it paves the way for a test of the yearly peak at 89.70. Conversely, if the cross dives below the Tenkan-sen at 87.35, expect a drop to the Kijun-sen at 87.01, followed by testing the top of the Kumo at below 86.00.
NZD/JPY Price Chart – Daily
New Zealand Dollar PRICE Today
The table below shows the percentage change of New Zealand Dollar (NZD) against listed major currencies today. New Zealand Dollar was the strongest against the US Dollar.
| USD | EUR | GBP | JPY | CAD | AUD | NZD | CHF | |
|---|---|---|---|---|---|---|---|---|
| USD | -0.00% | 0.00% | -0.01% | -0.01% | -0.04% | -0.09% | -0.01% | |
| EUR | 0.00% | -0.02% | -0.03% | -0.02% | -0.01% | 0.04% | -0.00% | |
| GBP | -0.01% | 0.02% | 0.00% | -0.02% | -0.05% | 0.01% | -0.02% | |
| JPY | 0.01% | 0.03% | 0.00% | 0.04% | -0.03% | -0.02% | 0.00% | |
| CAD | 0.01% | 0.02% | 0.02% | -0.04% | -0.01% | 0.02% | 0.00% | |
| AUD | 0.04% | 0.00% | 0.05% | 0.03% | 0.01% | 0.09% | 0.04% | |
| NZD | 0.09% | -0.04% | -0.01% | 0.02% | -0.02% | -0.09% | -0.03% | |
| CHF | 0.01% | 0.00% | 0.02% | -0.01% | -0.00% | -0.04% | 0.03% |
The heat map shows percentage changes of major currencies against each other. The base currency is picked from the left column, while the quote currency is picked from the top row. For example, if you pick the New Zealand Dollar from the left column and move along the horizontal line to the US Dollar, the percentage change displayed in the box will represent NZD (base)/USD (quote).
Author

Christian Borjon Valencia
FXStreet
Markets analyst, news editor, and trading instructor with over 14 years of experience across FX, commodities, US equity indices, and global macro markets.


