NZD/JPY Price Analysis: Upside move capped at 82.50, dip buyers could emerge around 81.00


  • A downbeat market sentiment put a lid on the NZD/JPY ten-day rally.
  • NZD/JPY: The daily chart indicates the pair is tilted to the upside, but the RSI confirms a correction is underway.
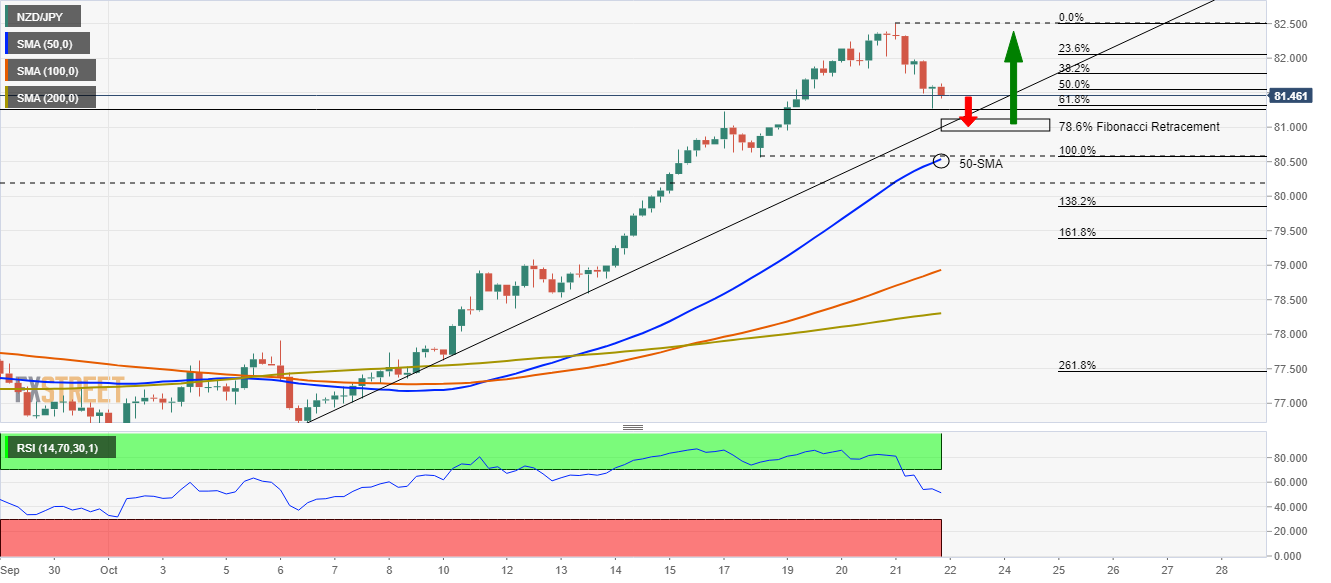
  • NZD/JPY: The 4-hour chart depicts the pair has an upward bias, but a correction towards the 78.6 Fibonacci retracement is on the cards.

The NZD/JPY is flat early in the Asian session, trading at 81.51 during the day at the time of writing. The market sentiment is mixed, as Asian equity futures seesaw between gainers and losers. However, on Thursday, a negative market sentiment capped the 10-day rally of the New Zealand dollar against the Japanese yen.

Nevertheless, the long-term trend is tilted to the upside as the bond yield differential widens. Furthermore, the Reserve Bank of New Zealand is in a hike-rate stance, adding further upward pressure on the cross-currency pair.

NZD/JPY Price Forecast: Technical outlook

Daily chart

The NZD/JPY upward trend is overextended, as it was a steep move, from 77.00 towards 82.57, a 500 plus upside move. The cross-currency is tilted to the upside, depicted by the daily moving averages (DMA’s) with an upslope located below the spot price. The Relative Strength Index (RSI) is at 71 in overbought levels, confirming that the pair could correct lower before resuming the prevailing trend.

If the NZD/JPY breaks below the Thursday low of 81.25, traders could expect a correction towards two crucial support levels. The first would be the October 18 low at 80.90 or the May 27 high at 80.17. Either way, in both cases, the NZD/JPY pair could resume the upward trend towards a renewed challenge of the 82.57 level.

4-hour chart

The 4-hour chart confirms the upward bias of the NZD/JPY pair, though it is approaching an upward slope trendline that acts as support. However, a move towards the confluence of the 78.6% Fibonacci retracement and the upslope trendline is on the cards. The intersection lies around 81.00. 

In case of a break lower of the latter, it would expose the 50-simple moving average (SMA) at 80.47. A breach of the abovementioned could send the pair tumbling towards the psychological 80.00

On the flip side, an upward rejection at 81.00 could open the way for a renewed test of the 2021 highs, but there would be some hurdles in the way. The first resistance would be the 50% Fibonacci retracement at 81.50, followed by 82.00. A breach above that level would expose the 82.50.

Share: Feed news

Information on these pages contains forward-looking statements that involve risks and uncertainties. Markets and instruments profiled on this page are for informational purposes only and should not in any way come across as a recommendation to buy or sell in these assets. You should do your own thorough research before making any investment decisions. FXStreet does not in any way guarantee that this information is free from mistakes, errors, or material misstatements. It also does not guarantee that this information is of a timely nature. Investing in Open Markets involves a great deal of risk, including the loss of all or a portion of your investment, as well as emotional distress. All risks, losses and costs associated with investing, including total loss of principal, are your responsibility. The views and opinions expressed in this article are those of the authors and do not necessarily reflect the official policy or position of FXStreet nor its advertisers. The author will not be held responsible for information that is found at the end of links posted on this page.

If not otherwise explicitly mentioned in the body of the article, at the time of writing, the author has no position in any stock mentioned in this article and no business relationship with any company mentioned. The author has not received compensation for writing this article, other than from FXStreet.

FXStreet and the author do not provide personalized recommendations. The author makes no representations as to the accuracy, completeness, or suitability of this information. FXStreet and the author will not be liable for any errors, omissions or any losses, injuries or damages arising from this information and its display or use. Errors and omissions excepted.

The author and FXStreet are not registered investment advisors and nothing in this article is intended to be investment advice.

Recommended content


Recommended content

Editors’ Picks

AUD/USD rises to two-day high ahead of Australian CPI

AUD/USD rises to two-day high ahead of Australian CPI

The Aussie Dollar recorded back-to-back positive days against the US Dollar and climbed more than 0.59% on Tuesday, as the US April S&P PMIs were weaker than expected. That spurred speculations that the Federal Reserve could put rate cuts back on the table. The AUD/USD trades at 0.6488 as Wednesday’s Asian session begins.

AUD/USD News

EUR/USD holds above 1.0700 on weaker US Dollar, upbeat Eurozone PMI

EUR/USD holds above 1.0700 on weaker US Dollar, upbeat Eurozone PMI

EUR/USD holds above the 1.0700 psychological barrier during the early Asian session on Wednesday. The weaker-than-expected US PMI data for April drags the Greenback lower and creates a tailwind for the pair. 

EUR/USD News

Gold price cautious despite weaker US Dollar and falling US yields

Gold price cautious despite weaker US Dollar and falling US yields

Gold retreats modestly after failing to sustain gains despite fall in US Treasury yields, weaker US Dollar. XAU/USD struggles to capitalize following release of weaker-than-expected S&P Global PMIs, fueling speculation about potential Fed rate cuts.

Gold News

Ethereum ETF issuers not giving up fight, expert says as Grayscale files S3 prospectus

Ethereum ETF issuers not giving up fight, expert says as Grayscale files S3 prospectus

Ethereum exchange-traded funds theme gained steam after the landmark approval of multiple BTC ETFs in January. However, the campaign for approval of this investment alternative continues, with evidence of ongoing back and forth between prospective issuers and the US SEC.

Read more

US versus the Eurozone: Inflation divergence causes monetary desynchronization

US versus the Eurozone: Inflation divergence causes monetary desynchronization

Historically there is a very close correlation between changes in US Treasury yields and German Bund yields. This is relevant at the current juncture, considering that the recent hawkish twist in the tone of the Fed might continue to push US long-term interest rates higher and put upward pressure on bond yields in the Eurozone.

Read more

Forex MAJORS

Cryptocurrencies

Signatures