|

NZD/JPY Price Analysis: Selling pressure intensifies, 20-day SMA under attack

  • NZD/JPY extended its decline on Monday, dropping to 90.90.
  • Technical indicators suggest a bearish outlook, with increasing selling pressure and a declining RSI.
  • The 20-day SMA is the last barrier against the sellers.

The NZD/JPY’s recent sideways movement seems to be ending, as the pair resumed its decline and fell slightly below the 20-day Simple Moving Average (SMA), below 91.00 on Monday. 

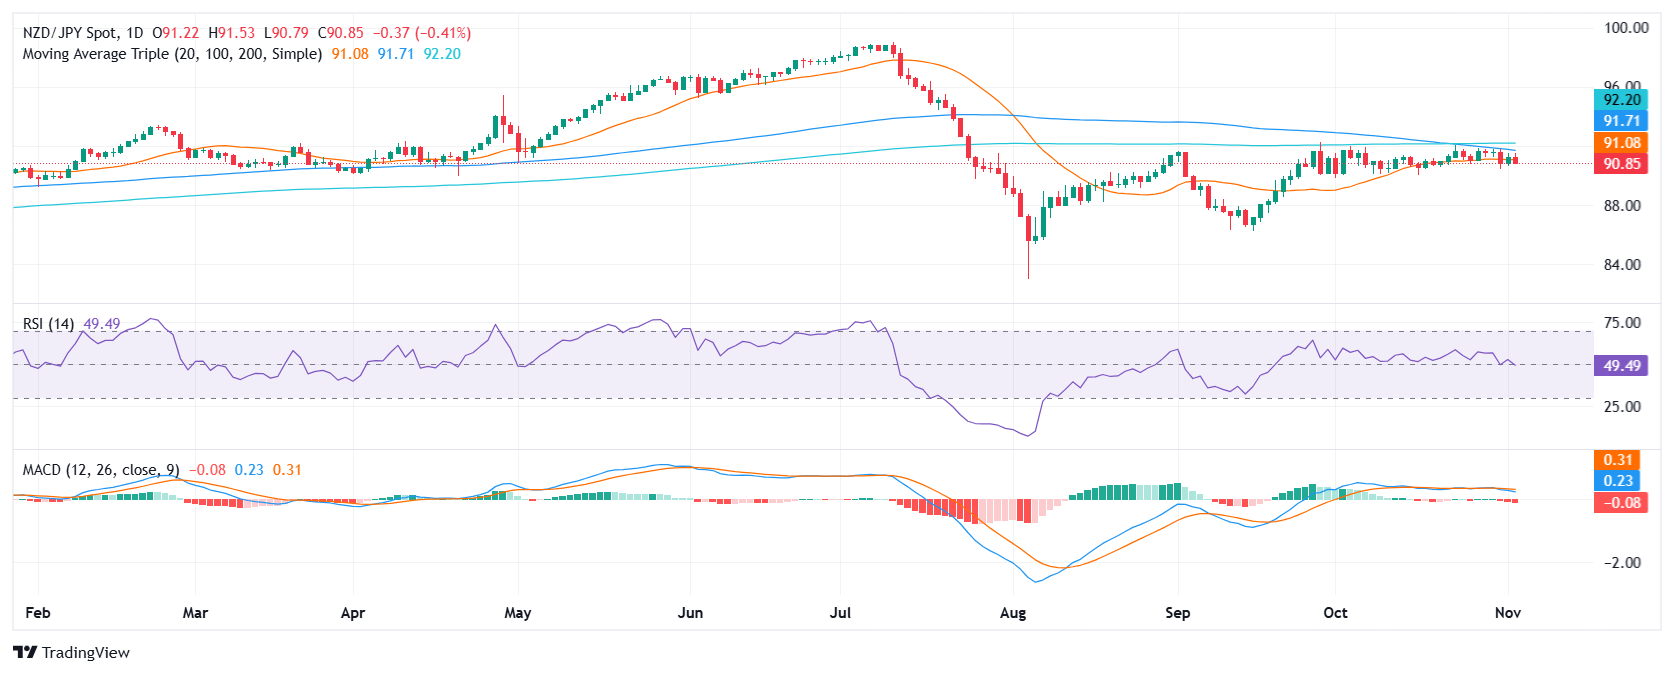
The Moving Average Convergence Divergence (MACD) indicator shows rising red bars, indicating increasing bearish momentum while the Relative Strength Index (RSI) is below 50, with a declining slope, also suggesting a bearish outlook.

The selling pressure is likely to continue, with potential support levels at 90.50, 90.00, and 89.50. If the pair breaks below 90.50, it could signal further decline. On the other hand, a close above 91.50 resistance could indicate a trend reversal. However, the overall outlook remains bearish, as the MACD and RSI indicators suggest strong selling pressure. In addition, the 100-day SMA is looming near the 20-day average and in case of completing a bearish crossover more selling pressure should be expected.

NZD/JPY daily chart

Author

Patricio Martín

Patricio is an economist from Argentina passionate about global finance and understanding the daily movements of the markets.

More from Patricio Martín
Share:

Editor's Picks

AUD/USD eyes 0.7150 barrier nine-day EMA

AUD/USD inches higher after registering modest losses in the previous day, trading around 0.7130 during the Asian hours. The technical analysis of the daily chart indicates that the pair is moving sideways within the rectangle pattern, suggesting a consolidation as neither the bulls nor the bears have enough momentum to take control of the market.

USD/JPY trades below 160.00 intervention threshold; bullish bias intact

The USD/JPY pair attracts some sellers during the Asian session amid fears that authorities will step in again to prop up the Japanese Yen. Furthermore, the Israel-Lebanon truce prompts some profit-taking around the US Dollar and exerts downward pressure on the currency pair.

Gold rebounds from one-week low as Israel-Lebanon truce pressures safe-haven USD

Gold gains some positive traction on Thursday and climbs to the $4,475 area during the Asian session, reversing a major part of the previous day's slide to a one-week low. The Israel-Lebanon truce prompts some profit-taking around the US Dollar and supports the commodity. 


Hyperliquid: ETF demand, capital rotation fuel HYPE rally as Bitcoin melts

Hyperliquid price sustains an upward trend near its all-time high of $75.76 on Thursday after posting 80% gains in May, while Bitcoin (BTC) retraces below $65,000, triggering a market-wide panic.

Kevin Warsh takes the Fed helm: What it means for the US Dollar
The Federal Reserve moves away from the highly predictable "forward guidance" model of the Jerome Powell era to a new “Kevin Warsh environment”, characterized by less communication, more policy surprises, and an increased focus on the Fed's complex balance sheet.
Recession on paper: What really moves the Canadian Loonie now?

Statistics Canada handed the headline writers a gift and the analysts a headache. Real GDP shrank 0.1% on an annualized basis in the first quarter, and with the fourth quarter of 2025 revised down to a 1.0% contraction, that is two negative quarters in a row, the textbook definition of a technical recession and Canada's first since the pandemic.