|

NZD/JPY Price Analysis: Sellers remain in the driver's seat, pinning down the downside

  • The NZD/JPY pair has been moving lower and broke below the key support of 87.50.
  • A break below 87.00 could open the doors to a further decline towards 86.00.

The NZD/JPY pair has resumed its decline on Wednesday after failing to hold the 87.50 area. The pair is now testing the support level of 87.00, and a break below this level could open the doors to a further decline. In the meantime, indicators show that the sellers are in command.

The Relative Strength Index (RSI) is nearing the oversold area while the MACD is printing red bars, indicating that selling pressure is still strong and that the pair is likely to continue to decline.

NZD/JPY daily chart

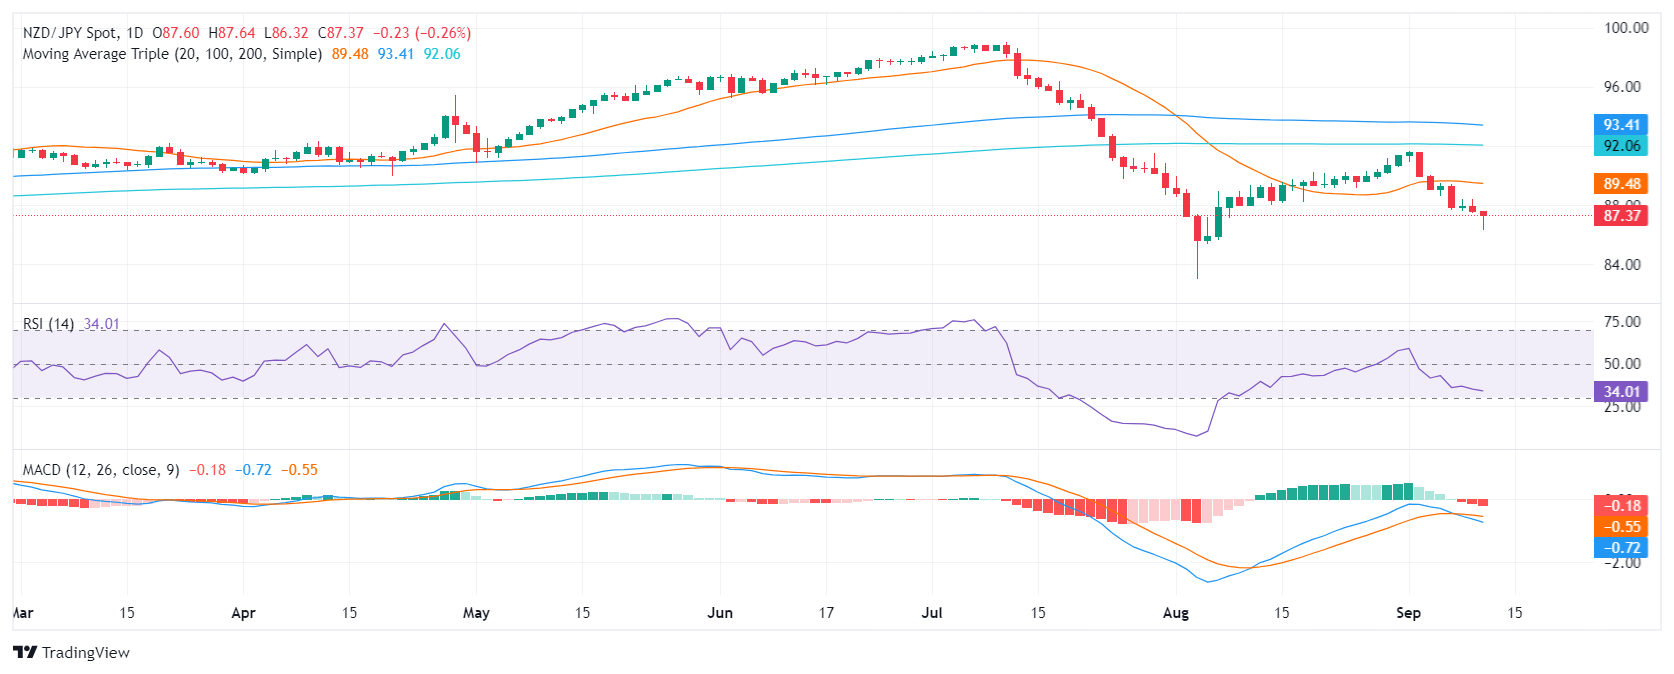
Overall, the technical picture for the NZD/JPY pair is bearish. The pair is showing strong signs of a downtrend, with the RSI in an oversold area and with the MACD printing red bars. Supports to the downside are located at 87.00, 86.500, and 86.00 while resistances are seen at 87.50, 88.00, and 89.00.

Author

Patricio Martín

Patricio is an economist from Argentina passionate about global finance and understanding the daily movements of the markets.

More from Patricio Martín
Share:

Editor's Picks

AUD/USD stays bid above 0.7100 on Australian trade data, Mideast optimism

AUD/USD clings to minor recovery gains above 0.7100 in the Asian session on Thursday as a new Israel-Lebanon ceasefire keeps a lid on the safe-haven US Dollar. Meanwhile, strong AustralianTrade Balane data also help the Aussie pair sustain the bounce from weekly lows.

USD/JPY hovers near the 160.00 intervention threshold on Mideast tensions

USD/JPY struggles to find acceptance above 160.00 and retreats from a one-month high in the Asian session on Thursday amid fears that authorities will step in again to prop up the Japanese Yen. Furthermore, a new Israel-Lebanon ceasefire caps the US Dollar and supports the currency pair. However, renewed US-Iran tensions keep the downside limited in the Greenback and the pair.

Gold defends 200-day SMA; upside seems capped on Iran uncertainty

Gold recovers from a one-week low near $4,425, or the 200-day SMA, in the Asian session on Thursday, as news of an Israel-Lebanon ceasefire acts as a headwind for the safe-haven US Dollar. However, renewed hostilities in the Gulf, along with stalled US-Iran peace talks, keep geopolitical risks in play and should support the USD, checking the Gold price rebound.


Ethereum: Long-term holders' capitulation drives ETH below $1,800

Ethereum has fallen below $1,800 on Wednesday, the first time since May 2025 following accelerated spot selling pressure and distributions from long-term holders. The Age Consumed metric, which tracks the movement of previously idle tokens or long-term holders' coins, spiked over the past two days as prices declined, indicating increased selling activity among this cohort.

Kevin Warsh takes the Fed helm: What it means for the US Dollar
The Federal Reserve moves away from the highly predictable "forward guidance" model of the Jerome Powell era to a new “Kevin Warsh environment”, characterized by less communication, more policy surprises, and an increased focus on the Fed's complex balance sheet.
Recession on paper: What really moves the Canadian Loonie now?

Statistics Canada handed the headline writers a gift and the analysts a headache. Real GDP shrank 0.1% on an annualized basis in the first quarter, and with the fourth quarter of 2025 revised down to a 1.0% contraction, that is two negative quarters in a row, the textbook definition of a technical recession and Canada's first since the pandemic.