|

NZD/JPY Price Analysis: Reversal pattern on the cards as indicators turn bullish

  • The NZD/JPY pair's latest price action shows a reversal of last week's losses with the pair extending gains from Tuesday’s session.
  • RSI is sharply rising, showing that buying pressure is recovering.
  • Decreasing red bars in the MACD suggests that selling pressure is weakening.

In Tuesday's session, the NZD/JPY pair rose by 0.95% above 88.00. Considering the fresh gains and the latest technical outlook, a reversal of last week's losses is on the cards.

The Relative Strength Index (RSI) is currently at 45, which is still in negative area. However, the slope of the RSI is sharply rising, indicating that buying pressure is recovering. The Moving Average Convergence Divergence (MACD) is also red, but the histogram is decreasing, suggesting that selling pressure is declining. This mixed technical outlook suggests that the NZD/JPY pair may continue to consolidate in the short term after the latest sharp losses.

NZD/JPY daily chart

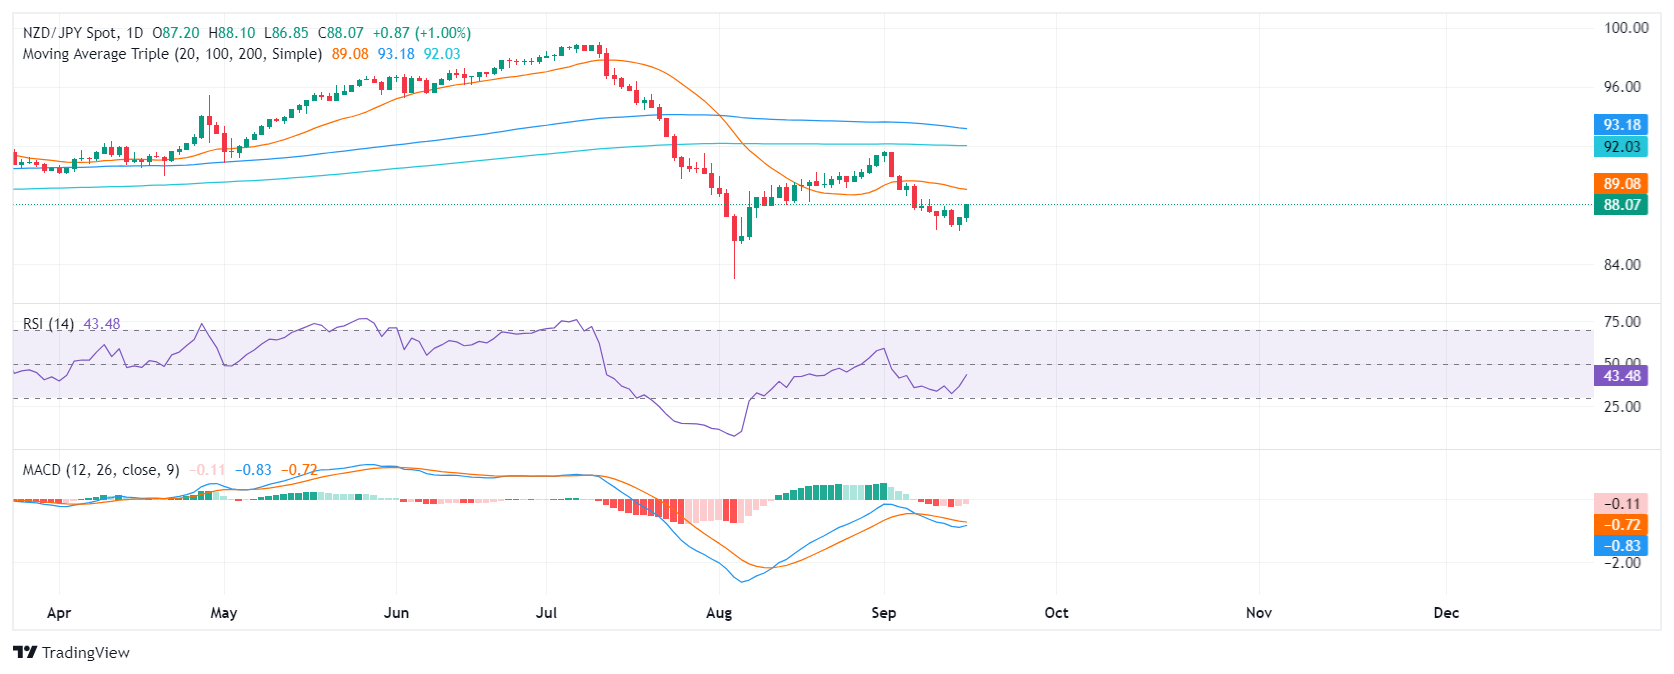
Supports to the downside are located at 86.50, 86.30, and 86.00, while resistances are seen at 87.50, 87.70, and 88.00. Traders should watch for a break above 88.50 or below 86.50 to confirm a breakout in either direction.

Author

Patricio Martín

Patricio is an economist from Argentina passionate about global finance and understanding the daily movements of the markets.

More from Patricio Martín
Share:

Editor's Picks

EUR/USD hovers around nine-day EMA above 1.1800

EUR/USD gains ground for the second successive session, trading around 1.1820 during the Asian hours on Monday. The 14-day Relative Strength Index momentum indicator stands at 51 (neutral) after recovering above the midline, indicating stabilizing momentum. 

GBP/USD gathers strength above 1.3500 amid tariff confusion

The GBP/USD pair gains traction to around 1.3520 during the early Asian session on Monday. The US Dollar faces some selling pressure against the Cable as tariff uncertainty lingers. Traders will take more cues from the US Producer Price Index report for January, which will be published later on Friday. 

Gold climbs to fresh monthly high on trade war fears, geopolitical risks, weaker USD

Gold registered its highest-ever weekly close, above the $5,100 mark on Friday, and gains strong follow-through traction at the start of a new week. This also marks the fourth straight day of a positive move and lifts the commodity beyond the $5,150 level, or a fresh monthly peak, during the Asian session. 

Cardano braces for impact as US tariff storm brews

Cardano is down 4% at press time on Monday, entering its third consecutive day of decline. Bearish bias in Cardano’s derivatives market positional buildup aligns with rising pressure on the broader cryptocurrencymarket amid US President Donald Trump's reassessment of global tariffs and domestic conflict with the US Supreme Court. 

Liberation day take two, the tariff machine just changed gears

Let me caveat this from the outset. What we are watching is first-order mechanics, not the grand macro endgame. This is the market’s immediate reflex to a 15% Trump tariff levy dressed up as judicial drama. The Supreme Court blocked Trump tarrif hammer. The White House came back with a scalpel.

Top Crypto Losers: Zcash, Pump.fun, and LayerZero extended losses as Bitcoin loses $65,000

The cryptocurrency market starts the week in panic mode, with altcoins Zcash, Pump.fun, and LayerZero. Bitcoin falls below $65,000 as the US President Donald Trump regroups amid renewed trade policy risks.