|

NZD/JPY Price Analysis: Persistent downtrend extends, bears test critical supports

  • NZD/JPY continues in its relentless sell-off, propelled by bearish technical indicators and dwindling volume.
  • The RSI remains in oversold territory, indicating potential exhaustion of the prevailing down move.
  • The MACD maintains its bearish alignment, aligning with the general trend.

The NZD/JPY pair remains entrenched in its bearish trajectory, giving no respite to the bears as it approaches critical support levels. This persistent decline has extended across multiple trading sessions, with the NZD/JPY shedding over 10% of its value since its highs in recent weeks. Notably, the pair has breached the 89.00 psychological level and settled well below the 200-day Simple Moving Average (SMA).

On Monday, the NZD/JPY fell by 1.60% to 86.00, reinforcing the sellers' dominance but cleared losses which plunged the index to a low of around 83.00, a critical support level. While the pair has been relentlessly declining, technical indicators like the Relative Strength Index (RSI) continue flashing oversold conditions are approaching. Such conditions may hint at a potential pause in the downtrend. Currently, the RSI resides around 20, signaling a prolonged period of selling, though a potential trend reversal remains a possibility.

NZD/JPY daily chart

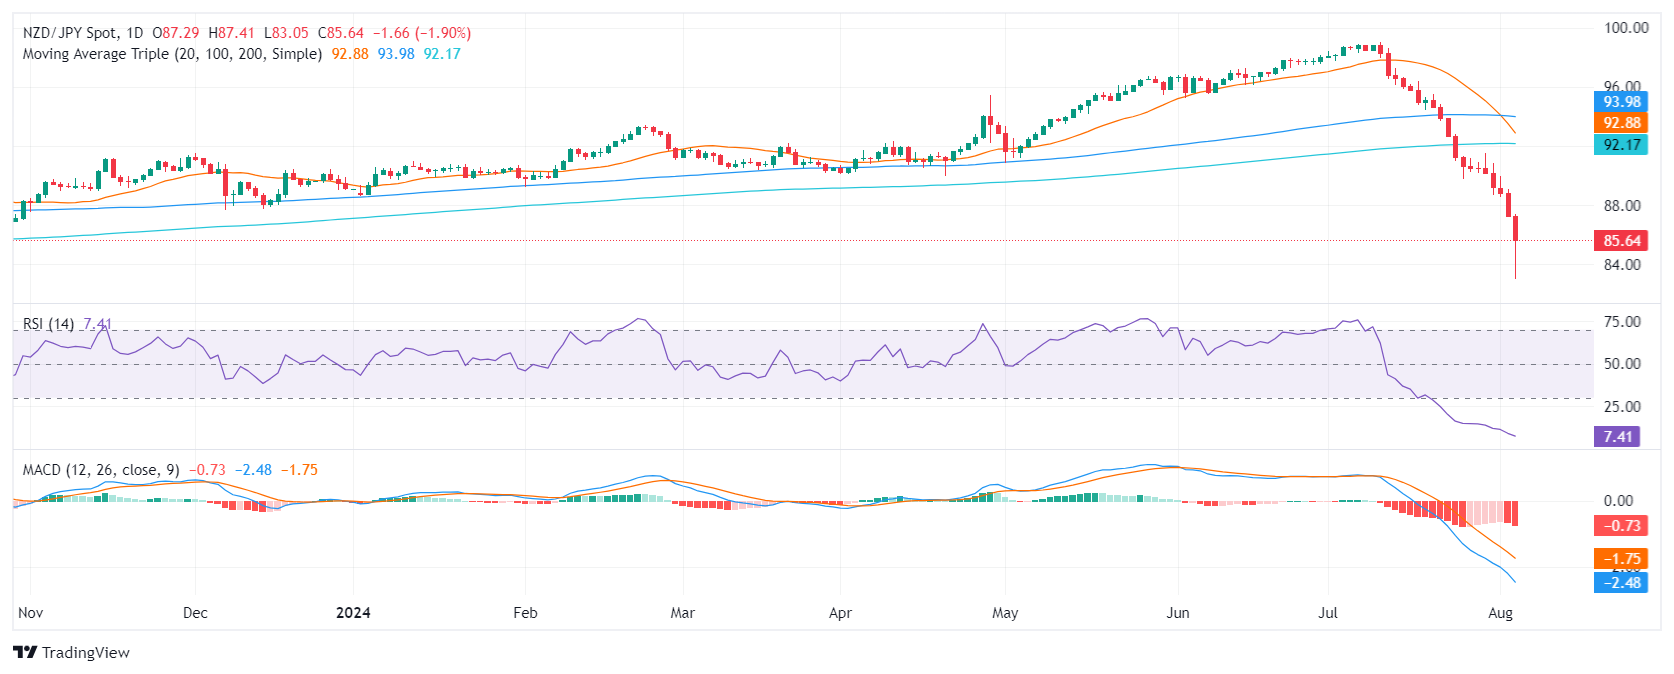
Navigating the depths of its descent, the pair is hovering near the 86.00 support level. Should this level fail to hold, further support awaits at 85.50 and 85.00, representing potential areas for a temporary reprieve. Conversely, resistance levels are positioned at 89.00 and 90.00, with the latter coinciding with the 200-day SMA.

Author

Patricio Martín

Patricio is an economist from Argentina passionate about global finance and understanding the daily movements of the markets.

More from Patricio Martín
Share:

Editor's Picks

AUD/USD stays bid above 0.7100 on Australian trade data, Mideast optimism

AUD/USD clings to minor recovery gains above 0.7100 in the Asian session on Thursday as a new Israel-Lebanon ceasefire keeps a lid on the safe-haven US Dollar. Meanwhile, strong AustralianTrade Balane data also help the Aussie pair sustain the bounce from weekly lows.

USD/JPY hovers near the 160.00 intervention threshold on Mideast tensions

USD/JPY struggles to find acceptance above 160.00 and retreats from a one-month high in the Asian session on Thursday amid fears that authorities will step in again to prop up the Japanese Yen. Furthermore, a new Israel-Lebanon ceasefire caps the US Dollar and supports the currency pair. However, renewed US-Iran tensions keep the downside limited in the Greenback and the pair.

Gold rebounds from one-week low as Israel-Lebanon truce pressures safe-haven USD

Gold gains some positive traction on Thursday and climbs to the $4,475 area during the Asian session, reversing a major part of the previous day's slide to a one-week low. The Israel-Lebanon truce prompts some profit-taking around the US Dollar and supports the commodity. 


Ethereum: Long-term holders' capitulation drives ETH below $1,800

Ethereum has fallen below $1,800 on Wednesday, the first time since May 2025 following accelerated spot selling pressure and distributions from long-term holders. The Age Consumed metric, which tracks the movement of previously idle tokens or long-term holders' coins, spiked over the past two days as prices declined, indicating increased selling activity among this cohort.

Kevin Warsh takes the Fed helm: What it means for the US Dollar
The Federal Reserve moves away from the highly predictable "forward guidance" model of the Jerome Powell era to a new “Kevin Warsh environment”, characterized by less communication, more policy surprises, and an increased focus on the Fed's complex balance sheet.
Recession on paper: What really moves the Canadian Loonie now?

Statistics Canada handed the headline writers a gift and the analysts a headache. Real GDP shrank 0.1% on an annualized basis in the first quarter, and with the fourth quarter of 2025 revised down to a 1.0% contraction, that is two negative quarters in a row, the textbook definition of a technical recession and Canada's first since the pandemic.