|

NZD/JPY Price Analysis: Pair stumbles below 100-day SMA, leaving rally in doubt

  • NZD/JPY slips on Wednesday, hovering around 88.75 after failing to overcome a mid-week ceiling.
  • RSI dips to 53 in positive territory, signaling a sudden loss of bullish momentum.
  • MACD histogram shows flat green bars, hinting that the recent upside may be running out of steam.

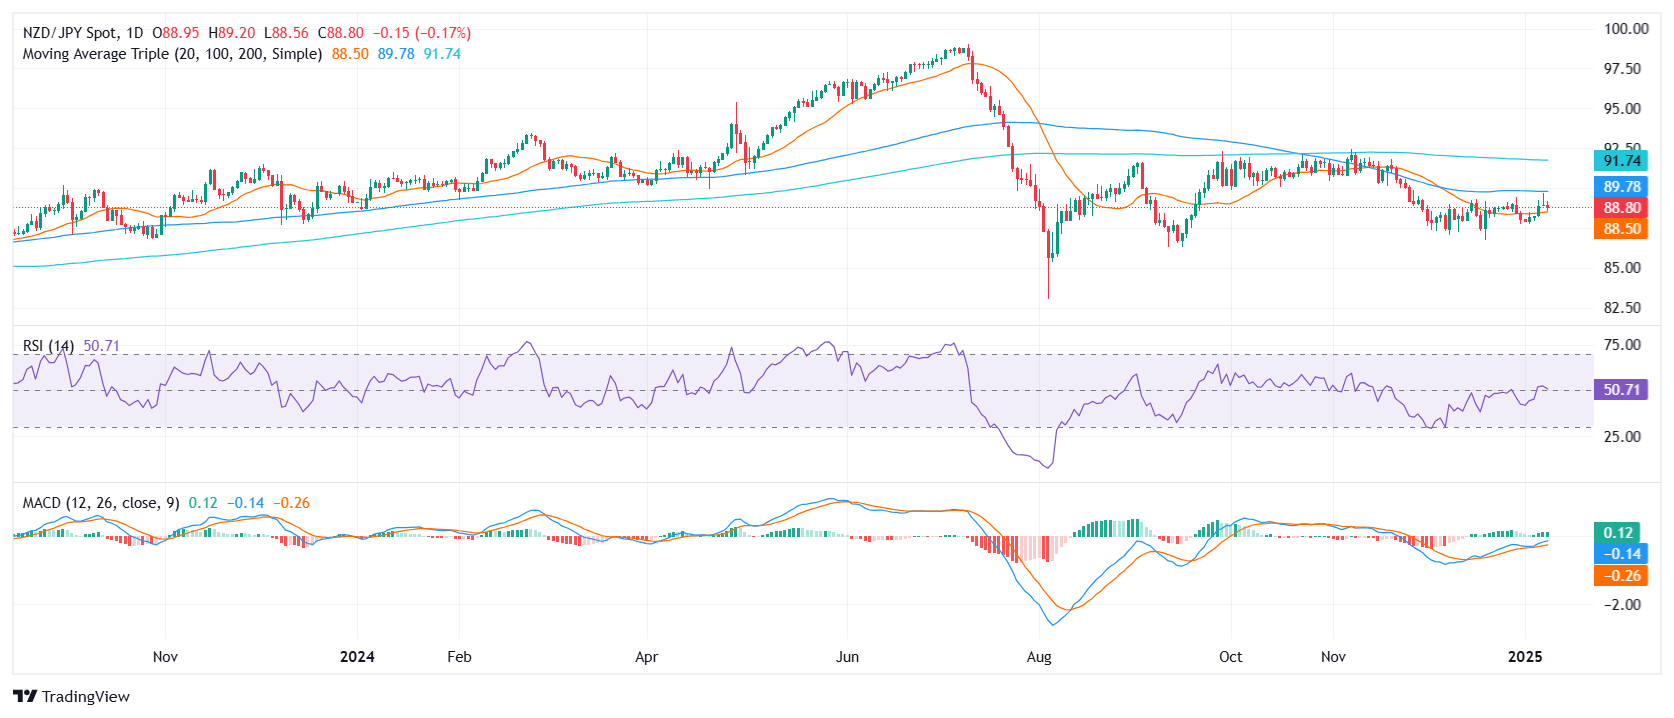
NZD/JPY retreated on Wednesday, declining by 0.33% to settle near 88.75. Earlier attempts to break above the 100-day Simple Moving Average (SMA) near 90.00 faltered, curbing the pair’s recent rebound. The Relative Strength Index (RSI) has pulled back to 53, indicating fading buying interest, while the Moving Average Convergence Divergence (MACD) histogram remains flat, suggesting limited follow-through on the upside push.

Should the bulls continue to struggle at the 100-day SMA, the pair may face additional downside pressure. Immediate support levels could appear around 88.50, with a deeper drop targeting 88.00 if selling accelerates. Conversely, a clean break above the 100-day SMA might reignite bullish momentum, paving the way toward the 89.50 zone before encountering potential psychological resistance at 90.00.

NZD/JPY daily chart

Author

Patricio Martín

Patricio is an economist from Argentina passionate about global finance and understanding the daily movements of the markets.

More from Patricio Martín
Share:

Markets move fast. We move first.

Orange Juice Newsletter brings you expert driven insights - not headlines. Every day on your inbox.

By subscribing you agree to our Terms and conditions.

Editor's Picks

EUR/USD struggles for direction amid USD gains

EUR/USD is trimming part of its earlier gains, coming under some mild downside pressure near 1.1730 as the US Dollar edges higher. Markets are still digesting the Fed’s latest rate decision, while also looking ahead to more commentary from Fed officials in the sessions ahead.

GBP/USD drops to daily lows near 1.3360

Disappointing UK data weighed on the Sterling towards the end of the week, triggering a pullback in GBP/USD to fresh daily lows near 1.3360. Looking ahead, the next key event across the Channel is the BoE meeting on December 18.

Gold losses momentum, challenges $4,300

Gold now gives away some gains and disputes the key $4,300 zone per troy ounce following earlier multi-week highs. The move is being driven by expectations that the Fed will deliver further rate cuts next year, with the yellow metal climbing despite a firmer Greenback and rising US Treasury yields across the board.

Litecoin Price Forecast: LTC struggles to extend gains, bullish bets at risk

Litecoin (LTC) price steadies above $80 at press time on Friday, following a reversal from the $87 resistance level on Wednesday. Derivatives data suggests a bullish positional buildup while the LTC futures Open Interest declines, flashing a long squeeze risk.

Big week ends with big doubts

The S&P 500 continued to push higher yesterday as the US 2-year yield wavered around the 3.50% mark following a Federal Reserve (Fed) rate cut earlier this week that was ultimately perceived as not that hawkish after all. The cut is especially boosting the non-tech pockets of the market.

Aave Price Forecast: AAVE primed for breakout as bullish signals strengthen

Aave (AAVE) price is trading above $204 at the time of writing on Friday and approaching the upper boundary of its descending parallel channel; a breakout from this structure would favor the bulls.