|

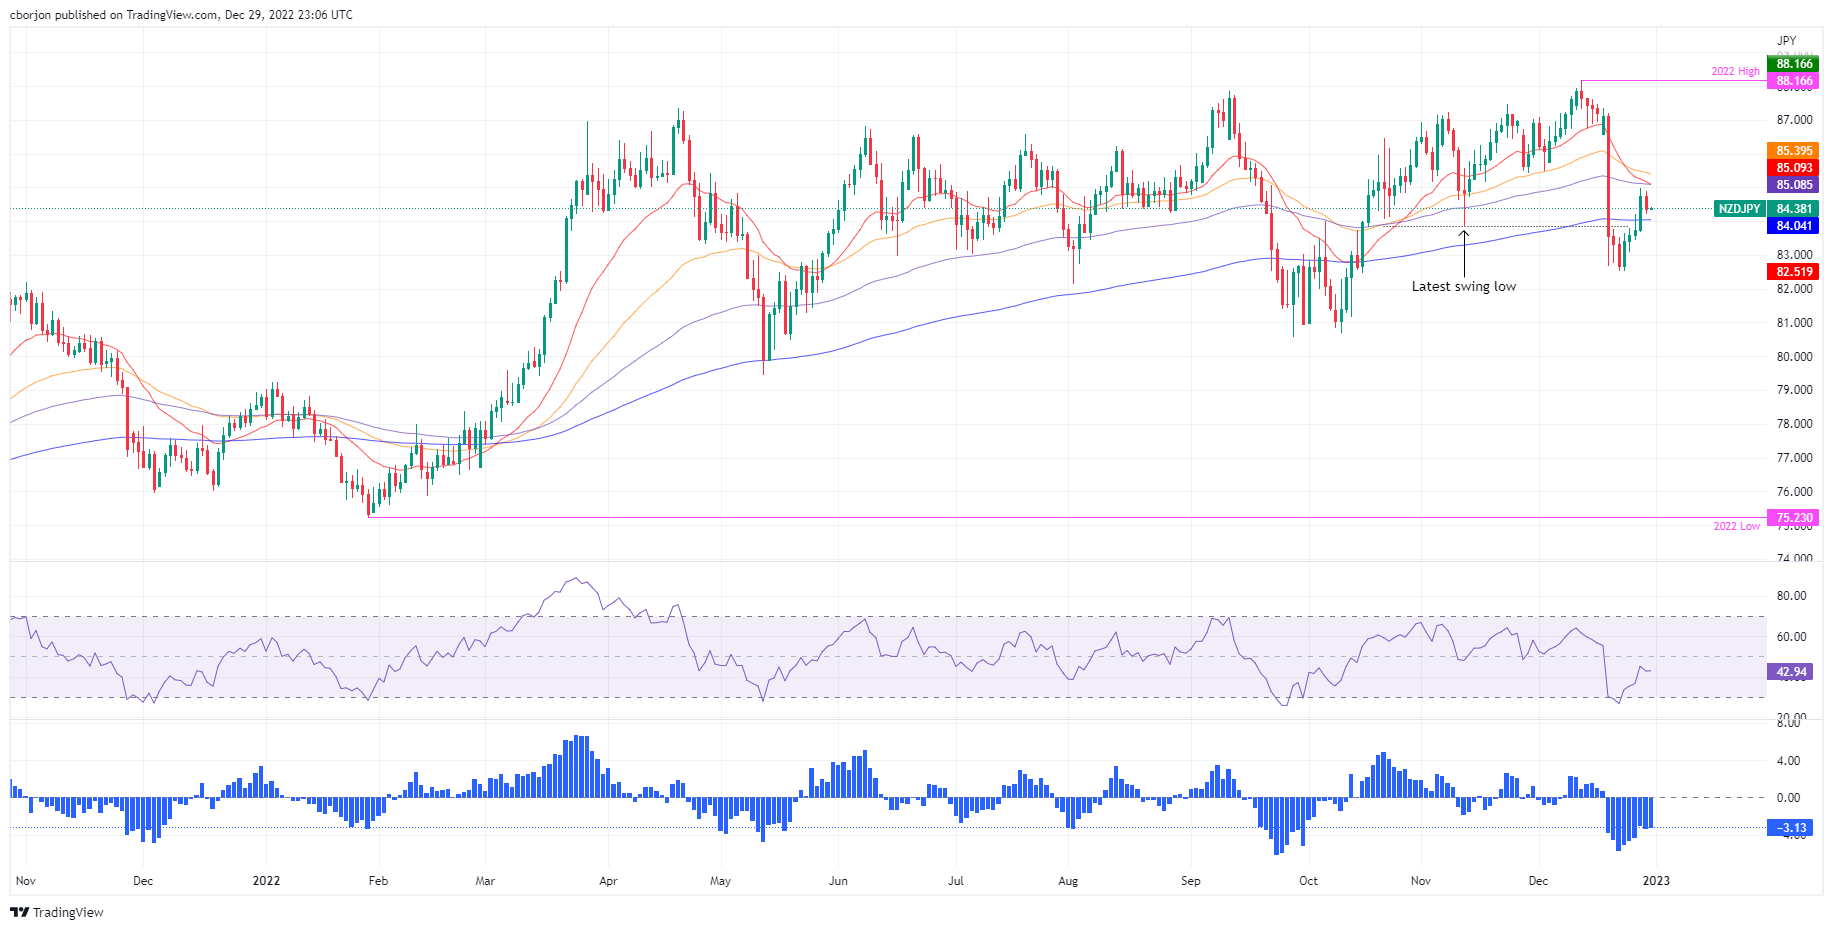
NZD/JPY Price Analysis: Downward pressured as a bearish harami emerged, at around 85.00

  • The confluence of the 20 and 100-day EMAs, around 85.00, capped the NZD/JPY rally.
  • A bearish harami candle chart pattern in the NZD/JPY daily chart could exacerbate a fall toward 82.50.
  • NZD/JPY: To face solid support around the 200-day EMA, which, once it gives way, further downside is expected.

The NZD/JPY continued its downtrend after plummeting more than 300 pips following the Bank of Japan (BoJ) adjustment of its Yield Curve Control (YCC) on the 10-year JGB to 0.50%, which bolstered appetite for the Japanese Yen (JPY) to the detriment of most G8 currencies. At the time of writing, the NZD/JPY is trading at 84.34, slightly above the December 29 daily low of 84.20.

NZD/JPY Price Analysis: Technical outlook

After hitting a weekly high of 84.98, the NZD/JPY formed a bearish harami candle chart pattern, which usually has a downward bias. Nevertheless, it should be said that the 200-day Exponential Moving Average (EMA) lies close to current exchange rates and could be a difficult hurdle to surpass at 84.04, which, once cleared, will exert downward pressure on the NZD/JPY. Oscillators like the Relative Strength Index (RSI) and the Rate of Change (RoC) suggest sellers are in charge, though the RSI is almost flat, and the RoC continues to approach its neutral level.

If the NZD/JPY clears the 200-day EMA, that could open the door for further losses. Hence, the NZD/JPY first support would be the December 28 low of 83.66. Once cleared, the NZD/JPY might fall toward the 83.00 figure, closely followed by the December 23 daily low at 82.52.

NZD/JPY Key Technical Levels

NZD/JPY

Overview
Today last price84.37
Today Daily Change-0.34
Today Daily Change %-0.40
Today daily open84.71
 
Trends
Daily SMA2085.82
Daily SMA5085.94
Daily SMA10085.14
Daily SMA20084.79
 
Levels
Previous Daily High84.99
Previous Daily Low83.67
Previous Weekly High87.36
Previous Weekly Low82.53
Previous Monthly High87.46
Previous Monthly Low83.86
Daily Fibonacci 38.2%84.49
Daily Fibonacci 61.8%84.17
Daily Pivot Point S183.92
Daily Pivot Point S283.14
Daily Pivot Point S382.6
Daily Pivot Point R185.24
Daily Pivot Point R285.78
Daily Pivot Point R386.57

Author

Christian Borjon Valencia

Markets analyst, news editor, and trading instructor with over 14 years of experience across FX, commodities, US equity indices, and global macro markets.

More from Christian Borjon Valencia
Share:

Editor's Picks

GBP/USD remains in two-day highs around 1.3260

GBP/USD adds to Friday’s bounce, gathering fresh traction and flirting with the 1.3270 zone on Monday, or two-day tops. Cable’s decent advance comes despite the move higher in the Greenback and investors’ assessing of UK PM K. Starmer's resignation.

EUR/USD remains offered; focus is on 1.1400

EUR/USD rapidly gives back Friday’s rebound and trades with marked losses near 1.1420, or three-month lows, in the latter part of Monday’s NA session. The pair’s intensifies its retracement following the continuation of the robust upside momentum in the US Dollar. Next on tap will be preliminary PMIs the Germany and the Euroland.

Gold bounces off lows, looks to surpass $4,200

Gold regains composure and leaves behind three-consecutive daily declines on Monday, looking to regain the area above the $4,200 mark per troy ounce. Reports of progress in the latest round of US-Iran talks are helping the precious metal maintain its footing at the start of the week, although the stronger Greenback seems to limit the upside potential for now.

XRP recovery underpinned by persistent ETF inflows
Ripple (XRP) gains momentum on Monday, trading above $1.15 as the crypto market widely recovers. This recovery comes amid easing geopolitical tensions in the Middle East, following reports that the United States (US) and Iran made progress in the first round of talks aimed at achieving a lasting peace agreement.
Is Shiba Inu dead or just in a crisis? The data behind SHIB's 95% crash

SHIB, the dog-themed meme coin that became one of the biggest success stories in crypto and turned early buyers into crypto millionaires, is facing tough times. Its price has fallen more than 32% so far this year, and it is down 95% from its all-time high in 2021. Is SHIB simply another fading meme coin, or is the market overlooking a possible recovery story?

Regime change: Inside Kevin Warsh's first move to make the Fed unreadable on purpose

The rate did not move. That was the least interesting thing about Kevin Warsh's first meeting in charge of the Fed. The FOMC held its benchmark at 3.50%-3.75% for the fourth straight meeting, exactly as priced, and then the new chair used his first press conference to dismantle the machinery the market has leaned on for a decade.