|

NZD/JPY Price Analysis: Double top in the daily chart, targets a fall to 80.50

  • Risk aversion weighed on risk-perceived currencies, bolstering the safe-haven Japanese Yen.
  • Hawkish commentary by Federal Reserve officials kept the New Zealand Dollar pressured.
  • NZD/JPY Price Analysis: Double top in the daily chart, targets a fall to 80.50.

The New Zealand Dollar (NZD) dropped on Monday, courtesy of US central bankers reassessing further rate hikes for the next year, alongside dented risk appetite by the Covid-19 crisis in China, triggering riots in the country. Therefore, the risk-perceived NZD/JPY weakened and tumbled by 1.55%. As the Asian session begins, the NZD/JPY is trading at 85.62.

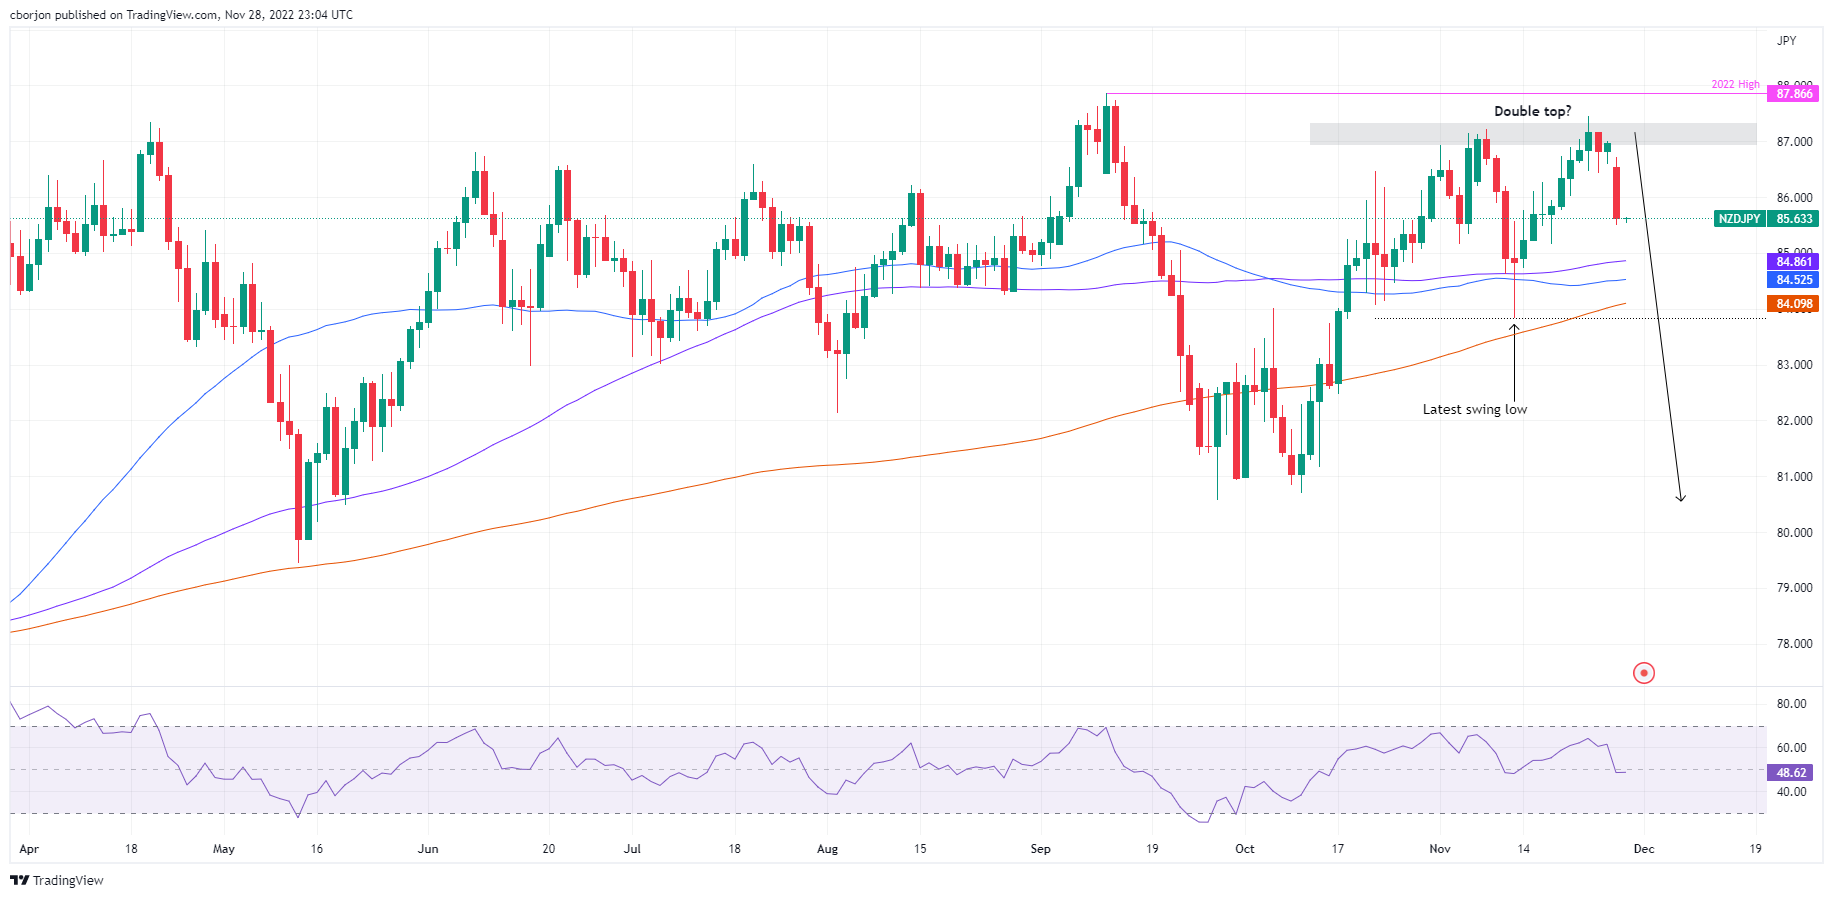
NZD/JPY Price Analysis: Technical outlook

The NZD/JPY daily chart dropped from around 86.70 to 85.60s, exacerbated by the formation of a “double top” chart pattern and the fall below last week’s low of around 86.01. Oscillators led by the Relative Strength Index (RSI) turned bearish, which would open the door for the NZD/JPY to test the 100-day Exponential Moving Average (EMA) at 84.86, followed by the 50-day EMA at 84.52. If the NZD/JPY extends its losses, it will probe the confluence of the November 11 swing low and the 200-day EMA around 83.84/84.00. A breach of the latter would confirm the “double top” and will target a fall.

The NZD/JPY first ceiling level would be the 86.00 mark as an alternate scenario. A breach of the latter will expose the 87.00 mark, followed by the two-month high at 87.45. Once cleared, it will invalidate the double top and pave the way toward the YTD high at 87.86.

NZD/JPY Key Technical Levels

NZD/JPY

Overview
Today last price85.6
Today Daily Change-1.31
Today Daily Change %-1.51
Today daily open86.91
 
Trends
Daily SMA2086.25
Daily SMA5084.55
Daily SMA10084.88
Daily SMA20084.07
 
Levels
Previous Daily High87.01
Previous Daily Low86.46
Previous Weekly High87.46
Previous Weekly Low86.03
Previous Monthly High86.51
Previous Monthly Low80.7
Daily Fibonacci 38.2%86.8
Daily Fibonacci 61.8%86.67
Daily Pivot Point S186.57
Daily Pivot Point S286.23
Daily Pivot Point S386.01
Daily Pivot Point R187.13
Daily Pivot Point R287.35
Daily Pivot Point R387.69

Author

Christian Borjon Valencia

Christian Borjon began his career as a retail trader in 2010, mainly focused on technical analysis and strategies around it. He started as a swing trader, as he used to work in another industry unrelated to the financial markets.

More from Christian Borjon Valencia
Share:

Markets move fast. We move first.

Orange Juice Newsletter brings you expert driven insights - not headlines. Every day on your inbox.

By subscribing you agree to our Terms and conditions.

Editor's Picks

EUR/USD moves sideways below 1.1800 on Christmas Eve

EUR/USD struggles to find direction and trades in a narrow channel below 1.1800 after posting gains for two consecutive days. Bond and stock markets in the US will open at the usual time and close early on Christmas Eve, allowing the trading action to remain subdued. 

GBP/USD keeps range around 1.3500 amid quiet markets

GBP/USD keeps its range trade intact at around 1.3500 on Wednesday. The Pound Sterling holds the upper hand over the US Dollar amid pre-Christmas light trading as traders move to the sidelines heading into the holiday season. 

Gold retreats from record highs, trades below $4,500

Gold retreats after setting a new record-high above $4,520 earlier in the day and trades in a tight range below $4,500 as trading volumes thin out ahead of the Christmas break. The US Dollar selling bias remains unabated on the back of dovish Fed expectations, which continues to act as a tailwind for the bullion amid persistent geopolitical risks.

Bitcoin slips below $87,000 as ETF outflows intensify, whale participation declines

Bitcoin price continues to trade around $86,770 on Wednesday, after failing to break above the $90,000 resistance. US-listed spot ETFs record an outflow of $188.64 million on Tuesday, marking the fourth consecutive day of withdrawals.

Economic outlook 2026-2027 in advanced countries: Solidity test

After a year marked by global economic resilience and ending on a note of optimism, 2026 looks promising and could be a year of solid economic performance. In our baseline scenario, we expect most of the supportive factors at work in 2025 to continue to play a role in 2026.

Avalanche struggles near $12 as Grayscale files updated form for ETF

Avalanche trades close to $12 by press time on Wednesday, extending the nearly 2% drop from the previous day. Grayscale filed an updated form to convert its Avalanche-focused Trust into an ETF with the US Securities and Exchange Commission.