|

NZD/JPY Price Analysis: Cross remains neutral, stuck between 92.00 and 91.00

  • NZD/JPY pair has seen a pullback with some selling pressure emerging.
  • Technical indicators suggest a weakening bullish outlook, with the RSI and MACD flattening.
  • The pair has formed a strong resistance near the convergence of the 100 and 200-day SMAs.

The NZD/JPY pair has retreated from its recent highs, signaling a potential shift in momentum. In Thursday's session, the pair shed 0.40% to 91.30, and continues to side-ways trade but with some signs of bulls weakening.

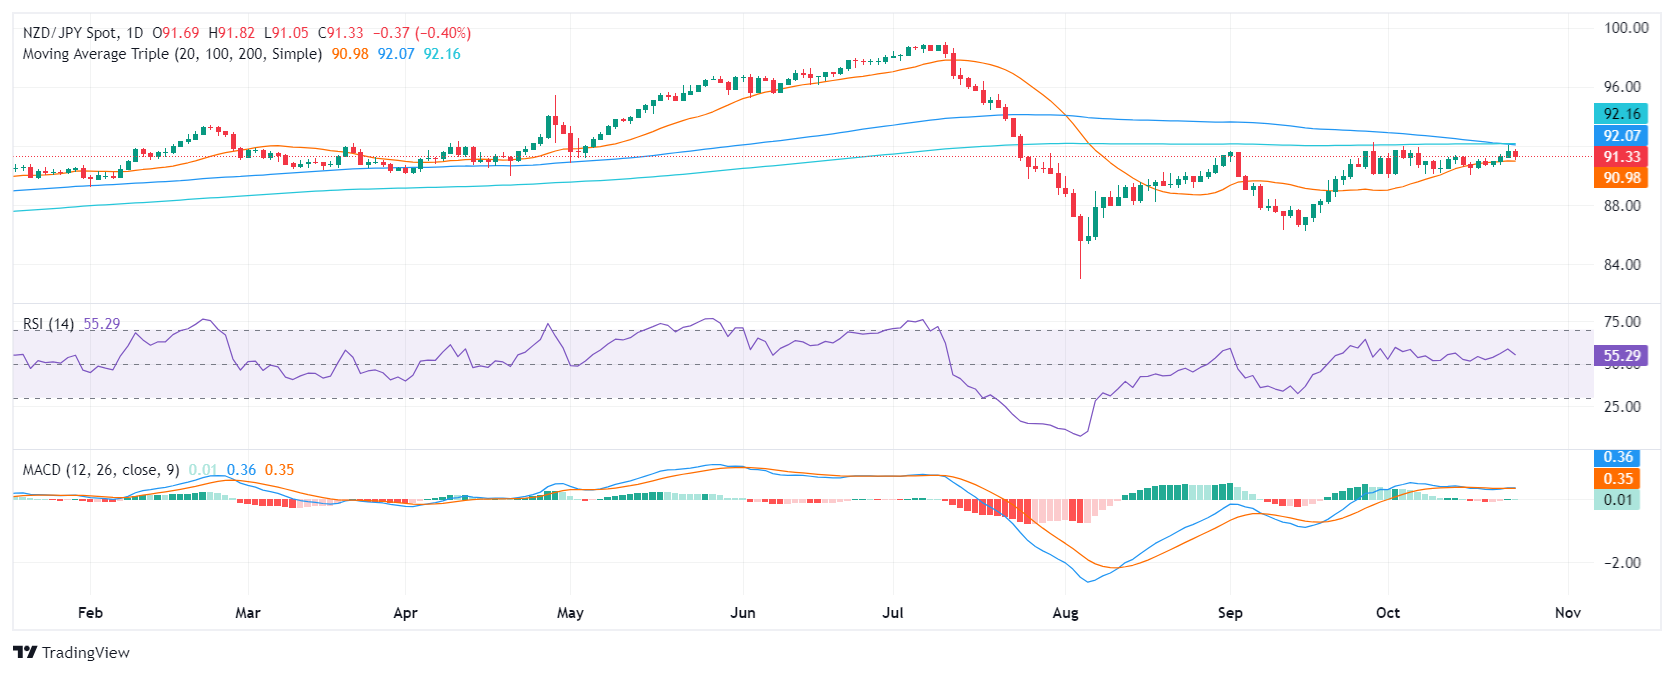
The technical indicators are mirroring this shift. The RSI, which measures the strength of buying pressure, has declined to 56, indicating a weakening bullish sentiment. The MACD, which gauges the relationship between the pair's short-term and long-term moving averages, has flattened, suggesting a neutral outlook remains flat and green.

Important support and resistance levels need to be watched closely are seen at 91.30, 91.00, and 90.50. Resistance levels are located at 91.50, 92.00 (the convergence of the 100 and 200-day SMAs), and 92.30. The pair's price action is likely to fluctuate within these levels in the near term. The 20-day SMA remains as a critical support level on the downside, and its breach could intensify the selling pressure and strengthen the bearish momentum.

That being said, the price action will be determined by fundamentals as the pair continues to be stuck between the 20-day SMA and the 100 and 200-day SMA convergence. Investors should monitor a breach of these two boundaries.

NZD/JPY daily chart


.

Author

Patricio Martín

Patricio is an economist from Argentina passionate about global finance and understanding the daily movements of the markets.

More from Patricio Martín
Share:

Markets move fast. We move first.

Orange Juice Newsletter brings you expert driven insights - not headlines. Every day on your inbox.

By subscribing you agree to our Terms and conditions.

Editor's Picks

EUR/USD recovers to 1.1750 region as 2025 draws to a close

Following the bearish action seen in the European session on Wednesday, EUR/USD regains its traction and recovery to the 1.1750 region. Nevertheless, the pair's volatility remains low as trading conditions thin out on the last day of the year.

GBP/USD stays weak near 1.3450 on modest USD recovery

GBP/USD remains under modest beairsh pressure and fluctuates at around 1.3450 on Wednesday. The US Dollar finds fresh demand due to the end-of-the-year position adjustments, weighing on the pair amid the pre-New Year trading lull. 

Gold retreats to $4,300 area, looks to post monthly gains

Gold stays on the back foot on the last day of 2025 and trades near $4,300, possibly pressured by profit-taking and position adjustments. Nevertheless, XAU/USD remains on track to post gains for December and extend its winning streak into a fifth consecutive month.

Bitcoin, Ethereum and XRP prepare for a potential New Year rebound

Bitcoin, Ethereum, and Ripple are holding steady on Wednesday after recording minor gains on the previous day. Technically, Bitcoin could extend gains within a triangle pattern while Ethereum and Ripple face critical overhead resistance. 

Economic outlook 2026-2027 in advanced countries: Solidity test

After a year marked by global economic resilience and ending on a note of optimism, 2026 looks promising and could be a year of solid economic performance. In our baseline scenario, we expect most of the supportive factors at work in 2025 to continue to play a role in 2026.

Crypto market outlook for 2026

Year 2025 was volatile, as crypto often is.  Among positive catalysts were favourable regulatory changes in the U.S., rise of Digital Asset Treasuries (DAT), adoption of AI and tokenization of Real-World-Assets (RWA).