|

NZD/JPY Price Analysis: Cross extends losses and falls to lows since mid-June

  • NZD/JPY continued its significant decline in Friday's session.
  • The bearish activity remains with the pair below the crucial 20-day SMA, suggesting persistent control by the bears.
  • Indicators in negative terrain now signal a bearish short-term outlook for the pair.

During Friday's trading session, the NZD/JPY pair continued its substantial drop from Thursday, recording a further loss of 0.20% and settling at 96.65. The pair remains well below the 20-day Simple Moving Average (SMA) of 97.80, reinforcing the bearish outlook in the short term.

The daily chart signals sustained negative conditions. The Relative Strength Index (RSI) improved slightly from Thursday's session but still remains in the negative territory at 40, indicating a continued declining market momentum. The Moving Average Convergence Divergence (MACD) concurs with this scenario, printing rising red bars indicative of rising selling activity.

NZD/JPY daily chart

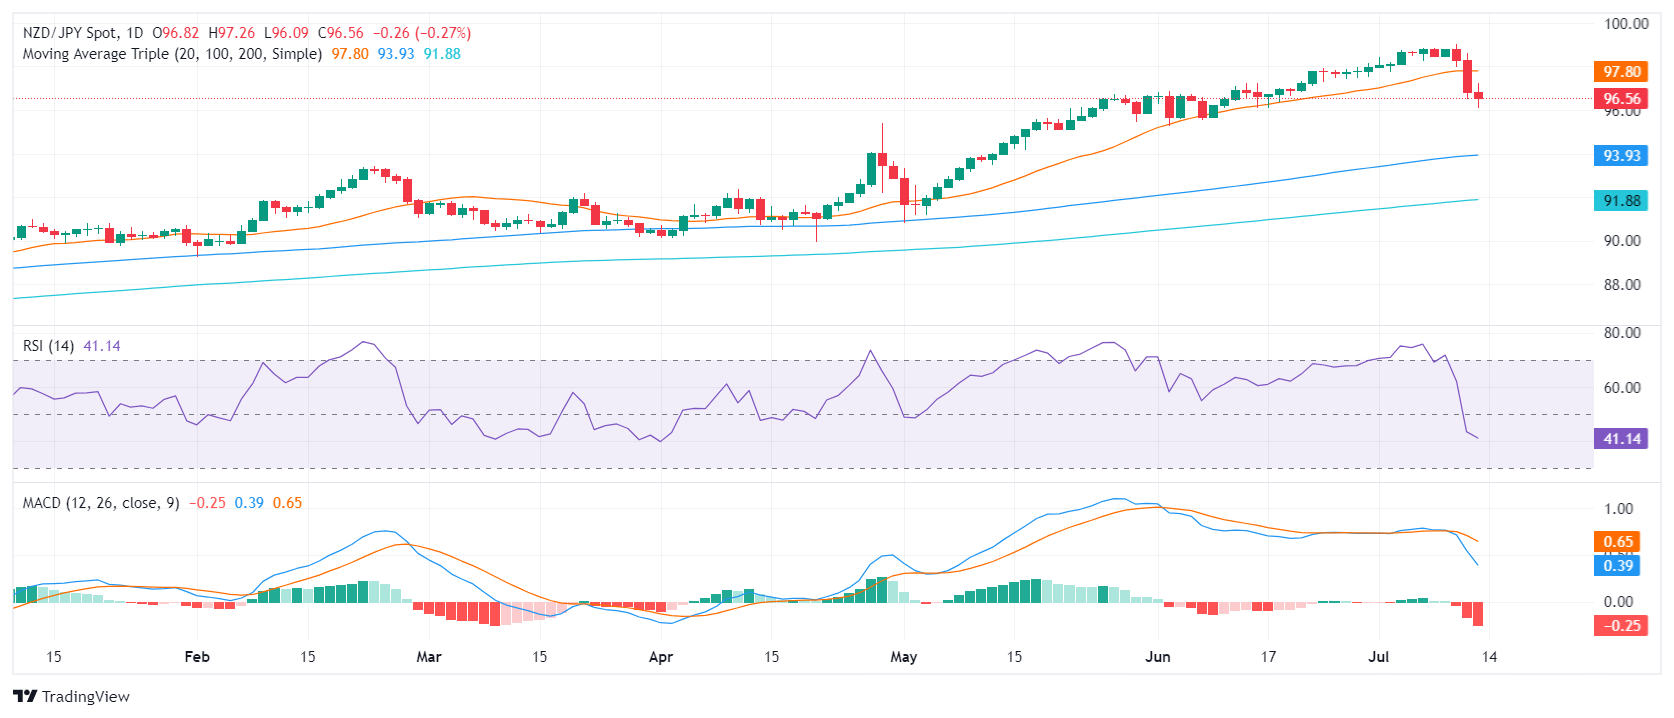
Bearing in mind the bearish momentum, immediate support levels lie at 96.50 96.00, and 95.50. Breaking these points would further validate the bearish perspective. On the other hand, resistance encounters are expected at past support levels of 97.00, 97.70 (20-day SMA), and the critical level of 98.00.

Author

Patricio Martín

Patricio is an economist from Argentina passionate about global finance and understanding the daily movements of the markets.

More from Patricio Martín
Share:

Markets move fast. We move first.

Orange Juice Newsletter brings you expert driven insights - not headlines. Every day on your inbox.

By subscribing you agree to our Terms and conditions.

Editor's Picks

EUR/USD runs past 1.1730 after tepid US macroeconomic figures

EUR/USD extends its gains and trades above 1.1730 in the American session on Thursday. The US Dollar resumed its decline, following much weaker-than-expected Initial Jobless Claims. Market players bet for additional rate cuts despite a mildly hawkish Fed.

GBP/USD ticks north beyond 1.3400 after US employment data

GBP/USD ticks beyond 1.3400 in the American session on Thursday, as the US Dollar is back on the losing side, following worse-than-anticipated US employment-related figures. The US Federal Reserve delivered a rate cut at its December meeting, in line with the market’s expectations.

Gold bounces off $4,200 neighborhood, down a little amid mixed fundamental cues

Gold recovers slightly from the vicinity of the $4,200 mark, though it sticks to its negative bias through the first half of the European session. The US Dollar attracts some buyers and recovers a part of the previous day's post-FOMC slump to its lowest level since October 24. This fails to assist the commodity in capitalizing on its modest intraday uptick to the weekly high.

Solana dips as hawkish Fed cuts dampen market sentiment

Solana price is trading below $130 on Thursday, after being rejected at the upper boundary of its falling wedge pattern. The broader market weakness following the Federal Reserve’s hawkish rate cut has added to downside momentum.

FOMC Summary: A split cut and a clear shift toward caution

The Federal Reserve (Fed) went ahead with a 25 basis points rate cut, taking the target range to 3.50–3.75%. But the tone around the decision mattered just as much as the move.

Solana dips as hawkish Fed cuts dampen market sentiment
Solana (SOL) price is trading below $130 at the time of writing on Thursday, after being rejected at the upper boundary of its falling wedge pattern. The broader market weakness following the Federal Reserve’s hawkish rate cut has added to downside momentum.